Vue lecture

Il y a de nouveaux articles disponibles, cliquez pour rafraîchir la page.
🔲 ☆

When Exactly Will the Eclipse Happen? A Multimillennium Tale of Computation

When Exactly Will the Eclipse Happen? A Multimillennium Tale of Computation

Updated and expanded from a post for the eclipse of August 21, 2017.

IWhen Exactly Will the Eclipse Happen? A Multimillennium Tale of Computation

Preparing for April 8, 2024

On April 8, 2024, there’s going to be a total eclipse of the Sun visible on a line across the US. But when exactly will the eclipse occur at a given location? Being able to predict astronomical events has historically been one of the great triumphs of exact science. But how well can it actually be done now?

The answer is well enough that even though the edge of totality moves at just over 1000 miles per hour, it’s possible to predict when it will arrive at a given location to within perhaps a second. And as a demonstration of this, for the total eclipse back in 2017 we created a website to let anyone enter their geo location (or address) and then immediately compute when the eclipse would reach them—as well as generate many pages of other information.

Click to enlarge

It’s an Old Business

These days it’s easy to find out when the next solar eclipse will be; indeed built right into the Wolfram Language there’s just a function that tells you (in this form the output is the “time of greatest eclipse”):

It’s also easy to find out, and plot, where the region of totality will be:

Or to determine that the whole area of totality (including lots of ocean and some of Canada) will be about a third of the area of the US:

But computing eclipses is not exactly a new business. In fact, the Antikythera device from 2000 years ago even tried to do it—using 37 metal gears to approximate the motion of the Sun and Moon (yes, with the Earth at the center). To me there’s something unsettling—and cautionary—about the fact that the Antikythera device stands as such a solitary piece of technology, forgotten but not surpassed for more than 1600 years.

But right there on the bottom of the device there’s an arm that moves around, and when it points to an Η or Σ marking, it indicates a possible Sun or Moon eclipse. The way of setting dates on the device is a bit funky (after all, the modern calendar wouldn’t be invented for another 1500 years), but if one takes the simulation on the Wolfram Demonstrations Project (which was calibrated back in 2012 when the Demonstration was created), and turns the crank to set the device for April 8, 2024, here’s what one gets:

Click to enlarge

Antikythera device in action

And, yes, all those gears move so as to line the Moon indicator up with the Sun—and to make the arm on the bottom point right at an H—just as it should for a solar eclipse. It’s amazing to see this computation successfully happen on a device designed 2000 years ago.

Of course the results are a lot more accurate today. Though, strangely, despite all the theoretical science that’s been done, the way we actually compute the position of the Sun and Moon is conceptually very much like the gears—and effectively epicycles—of the Antikythera device. It’s just that now we have the digital equivalent of hundreds of thousands of gears.

Why Do Eclipses Happen?

A total solar eclipse occurs when the Moon gets in front of the Sun from the point of view of a particular location on the Earth. And it so happens that at this point in the Earth’s history the Moon can just block the Sun because it has almost exactly the same angular diameter in the sky as the Sun (about 0.5° or 30 arc-minutes).

So when does the Moon get between the Sun and the Earth? Well, basically every time there’s a new moon (i.e. once every lunar month). But we know there isn’t an eclipse every month. So how come?

Well, actually, in the analogous situation of Ganymede and Jupiter, there is an eclipse every time Ganymede goes around Jupiter (which happens to be about once per week). Like the Earth, Jupiter’s orbit around the Sun lies in a particular plane (the “plane of the ecliptic”). And it turns out that Ganymede’s orbit around Jupiter also lies in essentially the same plane. So every time Ganymede reaches the “new moon” position (or, in official astronomy parlance, when it’s aligned “in syzygy”—pronounced sizz-ee-gee), it’s in the right place to cast its shadow onto Jupiter, and to eclipse the Sun wherever that shadow lands. (From Jupiter, Ganymede appears about 3 times the size of the Sun.)

But our Moon is different. Its orbit doesn’t lie in the plane of the ecliptic. Instead, it’s inclined at about 5°. (How it got that way is unknown, but it’s presumably related to how the Moon was formed.) But that 5° is what makes eclipses so comparatively rare: they can only happen when there’s a “new moon configuration” (syzygy) right at a time when the Moon’s orbit passes through the plane of the ecliptic.

To show what’s going on, let’s draw an exaggerated version of everything. Here’s the Moon going around the Earth, colored red whenever it’s close to the plane of the ecliptic:

Now let’s look at what happens over the course of about a year. We’re showing a dot for where the Moon is each day. And the dot is redder if the Moon is closer to the plane of the ecliptic that day. (Note that if this was drawn to scale, you’d barely be able to see the Moon’s orbit, and it wouldn’t ever seem to go backwards like it does here.)

Now we can start to see how eclipses work. The basic point is that there’s a solar eclipse whenever the Moon is both positioned between the Earth and the Sun, and it’s in the plane of the ecliptic. In the picture, those two conditions correspond to the Moon being as far as possible towards the center, and as red as possible. So far we’re only showing the position of the (exaggerated) Moon once per day. But to make things clearer, let’s show it four times a day—and now prune out cases where the Moon isn’t at least roughly lined up with the Sun:

And now we can see that at least in this particular case, there are two points (indicated by arrows) where the Moon is lined up and in the plane of the ecliptic (so shown in red)—and these points will then correspond to solar eclipses.

In different years, the picture will look slightly different, essentially because the Moon is starting at a different place in its orbit at the beginning of the year. Here are schematic pictures for a few successive years:

It’s not so easy to see exactly when eclipses occur here—and it’s also not possible to tell which are total eclipses where the Moon is exactly lined up, and which are only partial eclipses. But there’s at least an indication, for example, that there are “eclipse seasons” in different parts of the year where eclipses happen.

OK, so what does the real data look like? Here’s a plot for 20 years in the past and 20 years in the future, showing the actual days in each year when total and partial solar eclipses occur (the small dots everywhere indicate new moons):

The reason for the “drift” between successive years is just that the lunar month (29.53 days) doesn’t line up with the year, so the Moon doesn’t go through a whole number of orbits in the course of a year, with the result that at the beginning of a new year, the Moon is in a different phase. But as the picture makes clear, there’s quite a lot of regularity in the general times at which eclipses occur—and for example there are usually 2 eclipses in a given year—though there can be more (and in 0.2% of years there can be as many as 5, as there last were in 1935).

To see more detail about eclipses, let’s plot the time differences (in fractional years) between all successive solar eclipses for 100 years in the past and 100 years in the future:

And now let’s plot the same time differences, but just for total solar eclipses:

There’s obviously a fair amount of overall regularity here, but there are also lots of little fine structure and irregularities. And being able to correctly predict all these details has basically taken science the better part of a few thousand years.

Ancient History

It’s hard not to notice an eclipse, and presumably even from the earliest times people did. But were eclipses just reflections—or omens—associated with random goings-on in the heavens, perhaps in some kind of soap opera among the gods? Or were they things that could somehow be predicted?

A few thousand years ago, it wouldn’t have been clear what people like astrologers could conceivably predict. When will the Moon be at a certain place in the sky? Will it rain tomorrow? What will the price of barley be? Who will win a battle? Even now, we’re not sure how predictable all of these are. But the one clear case where prediction and exact science have triumphed is astronomy.

At least as far as the Western tradition is concerned, it all seems to have started in ancient Babylon—where for many hundreds of years, careful observations were made, and, in keeping with the ways of that civilization, detailed records were kept. And even today we still have thousands of daily official diary entries written in what look like tiny chicken scratches preserved on little clay tablets. “Night of the 14th: Cold north wind. Moon was in front of α Leonis. From 15th to 20th river rose 1/2 cubit. Barley was 1 kur 5 siit. 25th, last part of night, moon was 1 cubit 8 fingers behind ε Leonis. 28th, 74° after sunrise, solar eclipse…”

Click to enlarge

If one looks at what happens on a particular day, one probably can’t tell much. But by putting observations together over years or even hundreds of years, it’s possible to see all sorts of repetitions and regularities. And back in Babylonian times the idea arose of using these to construct an ephemeris—a systematic table that said where a particular heavenly body such as the Moon was expected to be at any particular time.

(Needless to say, reconstructing Babylonian astronomy is a complicated exercise in decoding what’s by now basically an alien culture. A key figure in this effort was a certain Otto Neugebauer, who happened to work down the hall from me at the Institute for Advanced Study in Princeton in the early 1980s. I would see him almost every day—a quiet white-haired chap, with a twinkle in his eye—and just sometimes I’d glimpse his huge filing system of index cards which I now realize was at the center of understanding Babylonian astronomy.)

One thing the Babylonians did was to measure surprisingly accurately the repetition period for the phases of the Moon—the so-called synodic month (or “lunation period”) of about 29.53 days. And they noticed that 235 synodic months was very close to 19 years—so that about every 19 years, dates and phases of the Moon repeat their alignment, forming a so-called Metonic cycle (named after Meton of Athens, who described it in 432 BC).

It probably helps that the random constellations in the sky form a good pattern against which to measure the precise position of the Moon (it reminds me of the modern fashion of wearing fractals to make motion capture for movies easier). But the Babylonians noticed all sorts of details of the motion of the Moon. They knew about its “anomaly”: its periodic speeding up and slowing down in the sky (now known to be a consequence of its slightly elliptical orbit). And they measured the average period of this—the so-called anomalistic month—to be about 27.55 days. They also noticed that the Moon went above and below the plane of the ecliptic (now known to be because of the inclination of its orbit)—with an average period (the so-called draconic month) that they measured as about 27.21 days.

And by 400 BC they’d noticed that every so-called saros of about 18 years 11 days all these different periods essentially line up (223 synodic months, 239 anomalistic months and 242 draconic months)—with the result that the Moon ends up at about the same position relative to the Sun. And this means that if there was an eclipse at one saros, then one can make the prediction that there’s going to be an eclipse at the next saros too.

When one’s absolutely precise about it, there are all sorts of effects that prevent precise repetition at each saros. But over timescales of more than 1300 years, there are in fact still strings of eclipses separated from each other by one saros. (Over the course of such a saros series, the locations of the eclipses effectively scan across the Earth; the upcoming eclipse is number 30 in a series of 71 that began in 1501 AD with an eclipse near the North Pole and will end in 2763 AD with an eclipse near the South Pole.)

Any given moment in time will be in the middle of quite a few saros series (right now it’s 40)—and successive eclipses will always come from different series. But knowing about the saros cycle is a great first step in predicting eclipses—and it’s for example what the Antikythera device uses. In a sense, it’s a quintessential piece of science: take many observations, then synthesize a theory from them, or at least a scheme for computation.

It’s not clear what the Babylonians thought about abstract, formal systems. But the Greeks were definitely into them. And by 300 BC Euclid had defined his abstract system for geometry. So when someone like Ptolemy did astronomy, they did it a bit like Euclid—effectively taking things like the saros cycle as axioms, and then proving from them often surprisingly elaborate geometrical theorems, such as that there must be at least two solar eclipses in a given year.

Ptolemy’s Almagest from around 150 AD is an impressive piece of work, containing among many other things some quite elaborate procedures—and explicit tables—for predicting eclipses. (Yes, even in the later printed version, numbers are still represented confusingly by letters, as they always were in ancient Greek.)

Click to enlarge

In Ptolemy’s astronomy, Earth was assumed to be at the center of everything. But in modern terms that just meant he was choosing to use a different coordinate system—which didn’t affect most of the things he wanted to do, like working out the geometry of eclipses. And unlike the mainline Greek philosophers he wasn’t trying to make a fundamental theory of the world; he just wanted whatever epicycles and so on he needed to fit what he observed.

The Dawn of Modern Science

For more than a thousand years Ptolemy’s theory of the Moon defined the state of the art. In the 1300s Ibn al-Shatir revised Ptolemy’s models, achieving somewhat better accuracy. In 1472 Regiomontanus (Johannes Müller), systematizer of trigonometry, published more complete tables as part of his launch of what was essentially the first-ever scientific publishing company. But even in 1543 when Nicolaus Copernicus introduced his Sun-centered model of the solar system, the results he got were basically the same as Ptolemy’s, even though his underlying description of what was going on was quite different.

It’s said that Tycho Brahe got interested in astronomy in 1560 at age 13 when he saw a solar eclipse that had been predicted—and over the next several decades his careful observations uncovered several effects in the motion of the Moon (such as speeding up just before a full moon)—that eventually resulted in perhaps a factor 5 improvement in the prediction of its position. To Tycho eclipses were key tests, and he measured them carefully, and worked hard to be able to predict their timing more accurately than to within a few hours. (He himself never saw a total solar eclipse, only partial ones.)

Click to enlarge

Armed with Tycho’s observations, Johannes Kepler developed his description of orbits as ellipses—introducing concepts like inclination and eccentric anomaly—and in 1627 finally produced his Rudolphine Tables, which got right a lot of things that had been got wrong before, and included all sorts of detailed tables of lunar positions, as well as vastly better predictions for eclipses.

Click to enlarge

Using Kepler’s Rudolphine Tables (and a couple of pages of calculations) the first known actual map of a solar eclipse was published in 1654. And while there are some charming inaccuracies in overall geography, the geometry of the eclipse isn’t too bad.

Whether it was Ptolemy’s epicycles or Kepler’s ellipses, there were plenty of calculations to do in determining the motions of heavenly bodies (and indeed the first known mechanical calculator—excepting the Antikythera device—was developed by a friend of Kepler’s, presumably for the purpose). But there wasn’t really a coherent underlying theory; it was more a matter of describing effects in ways that could be used to make predictions.

So it was a big step forward in 1687 when Isaac Newton published his Principia, and claimed that with his laws for motion and gravity it should be possible—essentially from first principles—to calculate everything about the motion of the Moon. (Charmingly, in his “Theory of the World” section he simply asserts as his Proposition XXII “That all the motions of the Moon… follow from the principles which we have laid down.”)

Newton was proud of the fact that he could explain all sorts of known effects on the basis of his new theory. But when it came to actually calculating the detailed motion of the Moon he had a frustrating time. And even after several years he still couldn’t get the right answer—in later editions of the Principia adding the admission that actually “The apse of the Moon is about twice as swift” (i.e. his answer was wrong by a factor of 2).

Still, in 1702 Newton was happy enough with his results that he allowed them to be published, in the form of a 20-page booklet on the “Theory of the Moon”, which proclaimed that “By this Theory, what by all Astronomers was thought most difficult and almost impossible to be done, the Excellent Mr. Newton hath now effected, viz. to determine the Moon’s Place even in her Quadratures, and all other Parts of her Orbit, besides the Syzygys, so accurately by Calculation, that the Difference between that and her true Place in the Heavens shall scarce be two Minutes…”

Click to enlarge

Newton didn’t explain his methods (and actually it’s still not clear exactly what he did, or how mathematically rigorous it was or wasn’t). But his booklet effectively gave a step-by-step algorithm to compute the position of the Moon. He didn’t claim it worked “at the syzygys” (i.e. when the Sun, Moon and Earth are lined up for an eclipse)—though his advertised error of two arc-minutes was still much smaller than the angular size of the Moon in the sky.

But it wasn’t eclipses that were the focus then; it was a very practical problem of his day: knowing the location of a ship out in the open ocean. It’s possible to determine what latitude you’re at just by measuring how high the Sun gets in the sky. But to determine longitude you have to correct for the rotation of the Earth—and to do that you have to accurately keep track of time. But back in Newton’s day, the clocks that existed simply weren’t accurate enough, especially when they were being tossed around on a ship.

But particularly after various naval accidents, the problem of longitude was deemed important enough that the British government in 1714 established a “Board of Longitude” to offer prizes to help get it solved. One early suggestion was to use the regularity of the moons of Jupiter discovered by Galileo as a way to tell time. But it seemed that a simpler solution (not requiring a powerful telescope) might just be to measure the position of our Moon, say relative to certain fixed stars—and then to back-compute the time from this.

But to do this one had to have an accurate way to predict the motion of the Moon—which is what Newton was trying to provide. In reality, though, it took until the 1760s before tables were produced that were accurate enough to be able to determine time to within a minute (and thus distance to within 15 miles or so). And it so happens that right around the same time a marine chronometer was invented that was directly able to keep good time.

The Three-Body Problem

One of Newton’s great achievements in the Principia was to solve the so-called two-body problem, and to show that with an inverse square law of gravity the orbit of one body around another must always be what Kepler had said: an ellipse.

In a first approximation, one can think of the Moon as just orbiting the Earth in a simple elliptical orbit. But what makes everything difficult is that that’s just an approximation, because in reality there’s also a gravitational pull on the Moon from the Sun. And because of this, the Moon’s orbit is no longer a simple fixed ellipse—and in fact it ends up being much more complicated. There are a few definite effects one can describe and reason about. The ellipse gets stretched when the Earth is closer to the Sun in its own orbit. The orientation of the ellipse precesses like a top as a result of the influence of the Sun. But there’s no way in the end to work out the orbit by pure reasoning—so there’s no choice but to go into the mathematics and start solving the equations of the three-body problem.

In many ways this represented a new situation for science. In the past, one hadn’t ever been able to go far without having to figure out new laws of nature. But here the underlying laws were supposedly known, courtesy of Newton. Yet even given these laws, there was difficult mathematics involved in working out the behavior they implied.

Over the course of the 1700s and 1800s the effort to try to solve the three-body problem and determine the orbit of the Moon was at the center of mathematical physics—and attracted a veritable who’s who of mathematicians and physicists.

An early entrant was Leonhard Euler, who developed methods based on trigonometric series (including much of our current notation for such things), and whose works contain many immediately recognizable formulas:

Click to enlarge

In the mid-1740s there was a brief flap—also involving Euler’s “competitors” Clairaut and d’Alembert—about the possibility that the inverse-square law for gravity might be wrong. But the problem turned out to be with the calculations, and by 1748 Euler was using sums of about 20 trigonometric terms and proudly proclaiming that the tables he’d produced for the three-body problem had predicted the time of a total solar eclipse to within minutes. (Actually, he had said there’d be 5 minutes of totality, whereas in reality there was only 1—but he blamed this error on incorrect coordinates he’d been given for Berlin.)

Mathematical physics moved rapidly over the next few decades, with all sorts of now-famous methods being developed, notably by people like Lagrange. And by the 1770s, for example, Lagrange’s work was looking just like it could have come from a modern calculus book (or from a Wolfram|Alpha step-by-step solution):

Click to enlarge

Particularly in the hands of Laplace there was increasingly obvious success in deriving the observed phenomena of what he called “celestial mechanics” from mathematics—and in establishing the idea that mathematics alone could indeed generate new results in science.

At a practical level, measurements of things like the position of the Moon had always been much more accurate than calculations. But now they were becoming more comparable—driving advances in both. Meanwhile, there was increasing systematization in the production of ephemeris tables. And in 1767 the annual publication began of what was for many years the standard: the British Nautical Almanac.

The almanac quoted the position of the Moon to the arc-second, and systematically achieved at least arc-minute accuracy. The primary use of the almanac was for navigation (and it was what started the convention of using Greenwich as the “prime meridian” for measuring time). But right at the front of each year’s edition were the predicted times of the eclipses for that year—in 1767 just two solar eclipses:

Click to enlarge

The Math Gets More Serious

At a mathematical level, the three-body problem is about solving a system of three ordinary differential equations that give the positions of the three bodies as a function of time. If the positions are represented in standard 3D Cartesian coordinates , the equations can be stated in the form:

3D Cartesian coordinates equations

The {x, y, z} coordinates here aren’t, however, what traditionally show up in astronomy. For example, in describing the position of the Moon one might use longitude and latitude on a sphere around the Earth. Or, given that one knows the Moon has a roughly elliptical orbit, one might instead choose to describe its motions by variables that are based on deviations from such an orbit. In principle it’s just a matter of algebraic manipulation to restate the equations with any given choice of variables. But in practice what comes out is often long and complex—and can lead to formulas that fill many pages.

But, OK, so what are the best kinds of variables to use for the three-body problem? Maybe they should involve relative positions of pairs of bodies. Or relative angles. Or maybe positions in various kinds of rotating coordinate systems. Or maybe quantities that would be constant in a pure two-body problem. Over the course of the 1700s and 1800s many treatises were written exploring different possibilities.

But in essentially all cases the ultimate approach to the three-body problem was the same. Set up the problem with the chosen variables. Identify parameters that, if set to zero, would make the problem collapse to some easy-to-solve form. Then do a series expansion in powers of these parameters, keeping just some number of terms.

The calculations were difficult, and people’s results often didn’t agree. And for example in 1843 Ada Lovelace noted that “In the solution of the famous problem of the Three Bodies, there are, out of about 295 coefficients of lunar perturbations [that had recently been computed]… only 101… agree precisely both in signs and in amount [with previous works]” (going on to say, rather farsightedly, that this was something the Analytical Engine would be able to solve).

By the 1860s Charles Delaunay had, however, spent 20 years developing the most extensive theory of the Moon using series expansions. He’d identified five parameters with respect to which to do his expansions (eccentricities, inclinations, and ratios of orbit sizes)—and in the end he generated about 1800 pages like this (yes, he really needed Mathematica!):

Click to enlarge

But the sad fact was that despite all this effort, he didn’t get terribly good answers. And eventually it became clear why. The basic problem was that Delaunay wanted to represent his results in terms of functions like sin and cos. But in his computations, he often wanted to do series expansions with respect to the frequencies of those functions. Here’s a minimal case:

And here’s the problem. Take a look even at the second term. Yes, the δ parameter may be small. But how about the parameter, standing for time? If you don’t want to make predictions very far out, that’ll stay small. But what if you want to figure out what will happen further in the future?

Well, eventually that term will get big. And higher-order terms will get even bigger. But unless the Moon is going to escape its orbit or something, the final mathematical expressions that represent its position can’t have values that are too big. So in these expressions the so-called secular terms that increase with must somehow cancel out.

But the problem is that at any given order in the series expansion, there’s no guarantee that will happen in a numerically useful way. And in Delaunay’s case—even though with immense effort he often went to 7th order or beyond—it didn’t.

One nice feature of Delaunay’s computation was that it was in a sense entirely algebraic: everything was done symbolically, and only at the very end were actual numerical values of parameters substituted in.

But even before Delaunay, Peter Hansen had taken a different approach—substituting numbers as soon as he could, and dropping terms based on their numerical size rather than their symbolic form. His presentations look less pure (notice things like all those , where is the time in years), and it’s more difficult to tell what’s going on. But as a practical matter, his results were much better, and in fact were used for many national almanacs from about 1862 to 1922, achieving errors as small as 1 or 2 arc-seconds at least over periods of a decade or so. (Over longer periods, the errors could rapidly increase because of the lack of terms that had been dropped as a result of what amounted to numerical accidents.)

Click to enlarge

Both Delaunay and Hansen tried to represent orbits as series of powers and trigonometric functions (so-called Poisson series). But in the 1870s, George Hill in the US Nautical Almanac Office proposed instead using as a basis numerically computed functions that came from solving an equation for two-body motion with a periodic driving force of roughly the kind the Sun exerts on the Moon’s orbit. A large-scale effort was mounted, and starting in 1892 Ernest W. Brown (who had moved to the US, but had been a student of George Darwin, Charles Darwin’s physicist son) took charge of the project and in 1918 produced what would stand for many years as the definitive “Tables of the Motion of the Moon”.

Brown’s tables consist of hundreds of pages like this—ultimately representing the position of the Moon as a combination of about 1400 terms with very precise coefficients:

Click to enlarge

He says right at the beginning that the tables aren’t particularly intended for unique events like eclipses, but then goes ahead and does a “worked example” of computing an eclipse from 381 BC, reported by Ptolemy:

Click to enlarge

It was an impressive indication of how far things had come. But ironically enough the final presentation of Brown’s tables had the same sum-of-trigonometric-functions form that one would get from having lots of epicycles. At some level it’s not surprising, because any function can ultimately be represented by epicycles, just as it can be represented by a Fourier or other series. But it’s a strange quirk of history that such similar forms were used.

Can the Three-Body Problem Be Solved?

It’s all well and good that one can find approximations to the three-body problem, but what about just finding an outright solution—like as a mathematical formula? Even in the 1700s, there’d been some specific solutions found—like Euler’s collinear configuration, and Lagrange’s equilateral triangle. But a century later, no further solutions had been found—and finding a complete solution to the three-body problem was beginning to seem as hopeless as trisecting an angle, solving the quintic, or making a perpetual motion machine. (That sentiment was reflected for example in a letter Charles Babbage wrote Ada Lovelace in 1843 mentioning the “horrible problem [of] the three bodies”—even though this letter was later misinterpreted by Ada’s biographers to be about a romantic triangle, not the three-body problem of celestial mechanics.)

In contrast to the three-body problem, what seemed to make the two-body problem tractable was that its solutions could be completely characterized by “constants of the motion”—quantities that stay constant with time (in this case notably the direction of the axis of the ellipse). So for many years one of the big goals with the three-body problem was to find constants of the motion.

In 1887, though, Heinrich Bruns showed that there couldn’t be any such constants of the motion, at least expressible as algebraic functions of the standard {x, y, z} position and velocity coordinates of the three bodies. Then in the mid-1890s Henri Poincaré showed that actually there couldn’t be any constants of the motion that were expressible as any analytic functions of the positions, velocities and mass ratios.

One reason that was particularly disappointing at the time was that it had been hoped that somehow constants of the motion would be found in n-body problems that would lead to a mathematical proof of the long-term stability of the solar system. And as part of his work, Poincaré also saw something else: that at least in particular cases of the three-body problem, there was arbitrarily sensitive dependence on initial conditions—implying that even tiny errors in measurement could be amplified to arbitrarily large changes in predicted behavior (the classic “chaos theory” phenomenon).

But having discovered that particular solutions to the three-body problem could have this kind of instability, Poincaré took a different approach that would actually be characteristic of much of pure mathematics going forward: he decided to look not at individual solutions, but at the space of all possible solutions. And needless to say, he found that for the three-body problem, this was very complicated—though in his efforts to analyze it he invented the field of topology.

Poincaré’s work all but ended efforts to find complete solutions to the three-body problem. It also seemed to some to explain why the series expansions of Delaunay and others hadn’t worked out—though in 1912 Karl Sundman did show that at least in principle the three-body problem could be solved in terms of an infinite series, albeit one that converges outrageously slowly.

But what does it mean to say that there can’t be a solution to the three-body problem? Galois had shown that there couldn’t be a solution to the generic quintic equation, at least in terms of radicals. But actually it’s still perfectly possible to express the solution in terms of elliptic or hypergeometric functions. So why can’t there be some more sophisticated class of functions that can be used to just “solve the three-body problem”?

Here are some pictures of what can actually happen in the three-body problem, with various initial conditions:

Click to enlarge

And looking at these immediately gives some indication of why it’s not easy to just “solve the three-body problem”. Yes, there are cases where what happens is fairly simple. But there are also cases where it’s not, and where the trajectories of the three bodies continue to be complicated and tangled for a long time.

So what’s fundamentally going on here? I don’t think traditional mathematics is the place to look. But I think what we’re seeing is actually an example of a general phenomenon I call computational irreducibility that I discovered in the 1980s in studying the computational universe of possible programs.

Many programs, like many instances of the three-body problem, behave in quite simple ways. But if you just start looking at all possible simple programs, it doesn’t take long before you start seeing behavior like this:

How can one tell what’s going to happen? Well, one can just keep explicitly running each program and seeing what it does. But the question is: is there some systematic way to jump ahead, and to predict what will happen without tracing through all the steps?

The answer is that in general there isn’t. And what I call the Principle of Computational Equivalence suggests that pretty much whenever one sees complex behavior, there won’t be.

Here’s the way to think about this. The system one’s studying is effectively doing a computation to work out what its behavior will be. So to jump ahead we’d in a sense have to do a more sophisticated computation. But what the Principle of Computational Equivalence says is that actually we can’t—and that whether we’re using our brains or our mathematics or a Turing machine or anything else, we’re always stuck with computations of the same sophistication.

So what about the three-body problem? Well, I strongly suspect that it’s an example of computational irreducibility: that in effect the computations it’s doing are as sophisticated as any computations that we can do, so there’s no way we can ever expect to systematically jump ahead and solve the problem. (We also can’t expect to just define some new finite class of functions that can just be evaluated to give the solution.)

I’m hoping that one day someone will rigorously prove this. There’s some technical difficulty, because the three-body problem is usually formulated in terms of real numbers that immediately have an infinite number of digits—but to compare with ordinary computation one has to require finite processes to set up initial conditions. (Ultimately one wants to show for example that there’s a “compiler” that can go from any program, say for a Turing machine, and can generate instructions to set up initial conditions for a three-body problem so that the evolution of the three-body problem will give the same results as running that program—implying that the three-body problem is capable of universal computation.)

I have to say that I consider Newton in a sense very lucky. It could have been that it wouldn’t have been possible to work out anything interesting from his theory without encountering the kind of difficulties he had with the motion of the Moon—because one would always be running into computational irreducibility. But in fact, there was enough computational reducibility and enough that could be computed easily that one could see that the theory was useful in predicting features of the world (and not getting wrong answers, like with the apse of the Moon)—even if there were some parts that might take two centuries to work out, or never be possible at all.

Newton himself was certainly aware of the potential issue, saying that at least if one was dealing with gravitational interactions between many planets then “to define these motions by exact laws admitting of easy calculation exceeds, if I am not mistaken, the force of any human mind”.
And even today it’s extremely difficult to know what the long-term evolution of the solar system will be.

It’s not particularly that there’s sensitive dependence on initial conditions: we actually have measurements that should be precise enough to determine what will happen for a long time. The problem is that we just have to do the computation—a bit like computing the digits of π—to work out the behavior of the -body problem that is our solar system.

Existing simulations show that for perhaps a few tens of millions of years, nothing too dramatic can happen. But after that we don’t know. Planets could change their order. Maybe they could even collide, or be ejected from the solar system. Computational irreducibility implies that at least after an infinite time it’s actually formally undecidable (in the sense of Gödel’s theorem or the halting problem) what can happen.

One of my children, when they were very young, asked me whether when dinosaurs existed the Earth could have had two moons. For years when I ran into celestial mechanics experts I would ask them that question—and it was notable how difficult they found it. Most now say that at least at the time of the dinosaurs we couldn’t have had an extra moon—though a billion years earlier it’s not clear.

We used to only have one system of planets to study. And the fact that there were (then) 9 of them used to be a classic philosopher’s example of a truth about the world that just happens to be the way it is, and isn’t “necessarily true” (like 2 + 2 = 4). But now of course we know about lots of exoplanets. And it’s beginning to look as if there might be a theory for things like how many planets a solar system is likely to have.

At some level there’s presumably a process like natural selection: some configurations of planets aren’t “fit enough” to be stable—and only those that are survive. In biology it’s traditionally been assumed that natural selection and adaptation is somehow what’s led to the complexity we see. But actually I suspect much of it is instead just a reflection of what generally happens in the computational universe—both in biology and in celestial mechanics. Now in celestial mechanics, we haven’t yet seen in the wild any particularly complex forms (beyond a few complicated gap structures in rings, and tumbling moons and asteroids). But perhaps elsewhere we’ll see things like those obviously tangled solutions to the three-body problem—that come closer to what we’re used to in biology.

It’s remarkable how similar the issues are across so many different fields. For example, the whole idea of using “perturbation theory” and series expansions that has existed since the 1700s in celestial mechanics is now also core to quantum field theory. But just like in celestial mechanics there’s trouble with convergence (maybe one should try renormalization or resummation in celestial mechanics). And in the end one begins to realize that there are phenomena—no doubt like turbulence or the three-body problem—that inevitably involve more sophisticated computations, and that need to be studied not with traditional mathematics of the kind that was so successful for Newton and his followers but with the kind of science that comes from exploring the computational universe.

Approaching Modern Times

But let’s get back to the story of the motion of the Moon. Between Brown’s tables, and Poincaré’s theoretical work, by the beginning of the 1900s the general impression was that whatever could reasonably be computed about the motion of the Moon had been computed.

Occasionally there were tests. Like for example in 1925, when there was a total solar eclipse visible in New York City, and the New York Times perhaps overdramatically said that “scientists [were] tense… [wondering] whether they or Moon is wrong as eclipse lags five seconds behind”. The fact is that a prediction accurate to 5 seconds was remarkably good, and we can’t do all that much better even today. (By the way, the actual article talks extensively about “Professor Brown”—as well as about how the eclipse might “disprove Einstein” and corroborate the existence of “coronium”—but doesn’t elaborate on the supposed prediction error.)

Click to enlarge

As a practical matter, Brown’s tables were not exactly easy to use: to find the position of the Moon from them required lots of mechanical desk calculator work, as well as careful transcription of numbers. And this led Leslie Comrie in 1932 to propose using a punch-card-based IBM Hollerith automatic tabulator—and with the help of Thomas Watson, CEO of IBM, what was probably the first “scientific computing laboratory” was established—to automate computations from Brown’s tables.

Click to enlarge

(When I was in elementary school in England in the late 1960s—before electronic calculators—I always carried around, along with my slide rule, a little book of “4-figure mathematical tables”. I think I found it odd that such a book would have an author—and perhaps for that reason I still remember the name: “L. J. Comrie”.)

By the 1950s, the calculations in Brown’s tables were slowly being rearranged and improved to make them more suitable for computers. But then with John F. Kennedy’s 1962 “We choose to go to the Moon”, there was suddenly urgent interest in getting the most accurate computations of the Moon’s position. As it turned out, though, it was basically just a tweaked version of Brown’s tables, running on a mainframe computer, that did the computations for the Apollo program.

At first, computers were used in celestial mechanics purely for numerical computation. But by the mid-1960s there were also experiments in using them for algebraic computation, and particularly to automate the generation of series expansions. Wallace Eckert at IBM started using FORMAC to redo Brown’s tables, while in Cambridge David Barton and Steve Bourne (later the creator of the “Bourne shell” (sh) in Unix) built their own CAMAL computer algebra system to try extending the kind of thing Delaunay had done. (And by 1970, Delaunay’s 7th-order calculations had been extended to 20th order.)

When I myself started to work on computer algebra in 1976 (primarily for computations in particle physics), I’d certainly heard about CAMAL, but I didn’t know what it had been used for (beyond vaguely “celestial mechanics”). And as a practicing theoretical physicist in the late 1970s, I have to say that the “problem of the Moon” that had been so prominent in the 1700s and 1800s had by then fallen into complete obscurity.

I remember for example in 1984 asking a certain Martin Gutzwiller, who was talking about quantum chaos, what his main interest actually was. And when he said “the problem of the Moon”, I was floored; I didn’t know there still was any problem with the Moon. As it turns out, in writing this post I found out that Gutzwiller was actually the person who took over from Eckert and spent nearly two decades working on trying to improve the computations of the position of the Moon.

Why Not Just Solve It?

Traditional approaches to the three-body problem come very much from a mathematical way of thinking. But modern computational thinking immediately suggests a different approach. Given the differential equations for the three-body problem, why not just directly solve them? And indeed in the Wolfram Language there’s a built-in function NDSolve for numerically solving systems of differential equations.

So what happens if one just feeds in equations for a three-body problem? Well, here are the equations:

Now as an example let’s set the masses to random values:

And let’s define the initial position and velocity for each body to be random as well:

Now we can just use NDSolve to get the solutions (it gives them as implicit approximate numerical functions of ):

And now we can plot them. And now we’ve got a solution to a three-body problem, just like that!

Well, obviously this is using the Wolfram Language and a huge tower of modern technology. But would it have been possible even right from the beginning for people to generate direct numerical solutions to the three-body problem, rather than doing all that algebra? Back in the 1700s, Euler already knew what’s now called Euler’s method for finding approximate numerical solutions to differential equations. So what if he’d just used that method to calculate the motion of the Moon?

The method relies on taking a sequence of discrete steps in time. And if he’d used, say, a step size of a minute, then he’d have had to take 40,000 steps to get results for a month, but he should have been able to successfully reproduce the position of the Moon to about a percent. If he’d tried to extend to 3 months, however, then he would already have had at least a 10% error.

Any numerical scheme for solving differential equations in practice eventually builds up some kind of error—but the more one knows about the equations one’s solving, and their expected solutions, the more one’s able to preprocess and adapt things to minimize the error. NDSolve has enough automatic adaptivity built into it that it’ll do pretty well for a surprisingly long time on a typical three-body problem. (It helps that the Wolfram Language and NDSolve can handle numbers with arbitrary precision, not just machine precision.)

But if one looks, say, at the total energy of the three-body system—which one can prove from the equations should stay constant—then one will typically see an error slowly build up in it. One can avoid this if one effectively does a change of variables in the equations to “factor out” energy. And one can imagine doing a whole hierarchy of algebraic transformations that in a sense give the numerical scheme as much help as possible.

And indeed since at least the 1980s that’s exactly what’s been done in practical work on the three-body problem, and the Earth-Moon-Sun system. So in effect it’s a mixture of the traditional algebraic approach from the 1700s and 1800s, together with modern numerical computation.

The Real Earth-Moon-Sun Problem

OK, so what’s involved in solving the real problem of the Earth-Moon-Sun system? The standard three-body problem gives a remarkably good approximation to the physics of what’s happening. But it’s obviously not the whole story.

For a start, the Earth isn’t the only planet in the solar system. And if one’s trying to get sufficiently accurate answers, one’s going to have to take into account the gravitational effect of other planets. The most important is Jupiter, and its typical effect on the orbit of the Moon is at about the level—sufficiently large that for example Brown had to take it into account in his tables.

The next effect is that the Earth isn’t just a point mass, or even a precise sphere. Its rotation makes it bulge at the equator, and that affects the orbit of the Moon at the level.

Orbits around the Earth ultimately depend on the full mass distribution and gravitational field of the Earth (which is what Sputnik-1 was nominally launched to map)—and both this, and the reverse effect from the Moon, come in at the level. At the level there are then effects from tidal deformations (“solid tides”) on the Earth and Moon, as well as from gravitational redshift and other general relativistic phenomena.

To predict the position of the Moon as accurately as possible one ultimately has to have at least some model for these various effects.

But there’s a much more immediate issue to deal with: one has to know the initial conditions for the Earth, Sun and Moon, or in other words, one has to know as accurately as possible what their positions and velocities were at some particular time.

And conveniently enough, there’s now a really good way to do that, because Apollo 11, 14 and 15 all left laser retroreflectors on the Moon. And by precisely timing how long it takes a laser pulse from the Earth to round-trip to these retroreflectors, it’s now possible in effect to measure the position of the Moon to millimeter accuracy.

OK, so how do modern analogs of the Babylonian ephemerides actually work? Internally they’re dealing with the equations for all the significant bodies in the solar system. They do symbolic preprocessing to make their numerical work as easy as possible. And then they directly solve the differential equations for the system, appropriately inserting models for things like the mass distribution in the Earth.

They start from particular measured initial conditions, but then they repeatedly insert new measurements, trying to correct the parameters of the model so as to optimally reproduce all the measurements they have. It’s very much like a typical machine learning task—with the training data here being observations of the solar system (and typically fitting just being least squares).

But, OK, so there’s a model one can run to figure out something like the position of the Moon. But one doesn’t want to have to explicitly do that every time one needs to get a result; instead one wants in effect just to store a big table of pre-computed results, and then to do something like interpolation to get any particular result one needs. And indeed that’s how it’s done today.

How It’s Really Done

Back in the 1960s NASA started directly solving differential equations for the motion of planets. The Moon was more difficult to deal with, but by the 1980s that too was being handled in a similar way. Ongoing data from things like the lunar retroreflectors was added, and all available historical data was inserted as well.

The result of all this was the JPL Development Ephemeris (JPL DE). In addition to new observations being used, the underlying system gets updated every few years, for example to get what’s needed for some spacecraft going to some new place in the solar system. (The latest is DE441—that follows DE432, which was built for going to Pluto.)

But so how is the actual ephemeris delivered? Well, for every thousand years covered, the ephemeris has about 100 megabytes of results, given as coefficients for Chebyshev polynomials, which are convenient for interpolation. And for any given quantity in any given coordinate system over a particular period of time, one accesses the appropriate parts of these results.

In Wolfram Language, it’s all packaged up into the function AstroPosition—which here gives the position of the Moon in coordinates relative to the equator of the Earth right now:

OK, but so how does one find an eclipse? Well, it’s an iterative process. Start with an approximation, perhaps from the saros cycle. Then interpolate the ephemeris and look at the result. Then keep iterating until one finds out just when the Moon will be in the appropriate position.

But actually there’s some more to do. Because what’s originally computed are the positions of the barycenters (centers of mass) of the various bodies. But now one has to figure out how the bodies are oriented.

The Earth rotates, and we know its rate quite precisely. But the Moon is basically locked with the same face pointing to the Earth, except that in practice there are small “librations” where the Moon wobbles a little back and forth—and these turn out to be particularly troublesome to predict.

Where Will the Eclipse Be?

OK, so let’s say one knows where the Earth, Moon and Sun are. How does one then figure out what type of eclipse will happen, and where on the Earth the eclipse will actually hit? Well, there’s some further geometry to do. And here’s the beginning of what’s involved:

Basically the Moon generates a cone of shadow, and then the question is how this cone intersects the Earth. If the tip of the cone is inside the Earth, that means there’ll be a region of total shadow (“umbra”) on the Earth—and a total eclipse. (If the tip is above the Earth, there’ll be an annular eclipse, in which there’s a “ring of sun” visible around the Moon.)

By the way, the more complete geometry is like this (again not to scale)

where now we’ve included the penumbra in which only part of the Sun is shadowed by the Moon. In the particular case shown, the umbra cone “misses the Earth”, so there’s no total eclipse, but there’s still a partial eclipse where part of the Sun is shadowed.

OK, but let’s say there’s going to be a total eclipse. To see where on the Earth the region of totality will be, we have to work out where the “cone of total shadow” (i.e. umbra) will intersect the surface of the Earth. It’s a somewhat complicated 3D geometry problem:

It’s easiest to understand what happens by looking at things from the position of the Sun. The light gray region is the penumbra, and the little black dot is the region of totality (i.e. the umbra):

As the Earth and Moon move in their orbits, the region of shadow will move relative to the Earth:

But now there’s another part of the story, which is the rotation of the Earth. And if we include that, we’ll see that the region of totality (at least in this case) traces out a kind of S-shaped curve on the surface of the Earth:

All this tricky geometry got figured out in 1824 by Friedrich Bessel, who introduced what are now called the Besselian elements—eight variables that specify the location, orientation and aperture of the umbra and penumbra cones, as well as the orientation of the Earth, as a function of time. And for any given eclipse, the whole story of its appearance and trajectory on the surface of the Earth is determined by its Besselian elements.

When Will the Eclipse Arrive?

OK, so now we know what the trajectory of an eclipse will be. But how do we figure out at what time the eclipse will actually reach a given point on Earth? Well, first we have to be clear on our definition of time. And there’s an immediate issue with the speed of light and special relativity. What does it mean to say that the positions of the Earth and Sun are such-and-such at such-and-such a time? Because it takes light about 8 minutes to get to the Earth from the Sun, we only get to see where the Sun was 8 minutes ago, not where it is now.

And what we need is really a classic special relativity setup. We essentially imagine that the solar system is filled with a grid of clocks that have been synchronized by light pulses. And what a modern ephemeris does is to quote the results for positions of bodies in the solar system relative to the times on those clocks. (General relativity implies that in different gravitational fields the clocks will run at different rates, but for our purposes this is a tiny effect. But what isn’t a tiny effect is including retardation in the equations for the -body problem—making them become delay differential equations.)

But now there’s another issue. If one’s observing the eclipse, one’s going to be using some timepiece (phone?) to figure out what time it is. And if it’s working properly that timepiece should show official “civil time” that’s based on UTC—which is what NTP internet time is synchronized to. But the issue is that UTC has a complicated relationship to the time used in the astronomical ephemeris.

The starting point is what’s called UT1: a definition of time in which one day is the average time it takes the Earth to rotate once relative to the Sun. But the point is that this average time isn’t constant, because the rotation of the Earth is gradually slowing down, primarily as a result of interactions with the Moon. But meanwhile, UTC is defined by an atomic clock whose timekeeping is independent of any issues about the rotation of the Earth.

There’s a convention for keeping UT1 aligned with UTC: if UT1 is going to get more than 0.9 seconds away from UTC, then a leap second is added to UTC. One might think this would be a tiny effect, but actually, since 1972, a total of 27 leap seconds have been added (as specified in the Wolfram Language by GeoOrientationData):

Exactly when a new leap second will be needed is unpredictable; it depends on things like what earthquakes have occurred. But we need to account for leap seconds if we’re going to get the time of the eclipse correct to the second relative to UTC or internet time.

There are a few other effects that are also important in the precise observed timing of the eclipse. The most obvious is geo elevation. In doing astronomical computations, the Earth is assumed to be an ellipsoid. (There are many different definitions, corresponding to different geodetic “datums”—and that’s an issue in defining things like “sea level”, but it’s not relevant here.) But if you’re at a different height above the ellipsoid, the cone of shadow from the eclipse will reach you at a different time. And the size of this effect can be as much as 0.3 seconds for every 1000 feet of height.

All of the effects we’ve talked about we’re readily able to account for. But there is one remaining effect that’s a bit more difficult. Right at the beginning or end of totality one typically sees points of light on the rim of the Moon. Known as Baily’s beads, these are the result of rays of light that make it to us between mountains on the Moon. Figuring out exactly when all these rays are extinguished requires taking geo elevation data for the Moon, and effectively doing full 3D ray tracing. And in doing this, one ends with the rather bizarre conclusion that the region of shadow on the earth isn’t a perfect circle; instead it’s roughly a polygon, each of whose edges is associated with a particular Baily’s bead. The effect of this can last as long as a second, and can cause the precise edge of totality to move by as much as a mile. (One can also imagine effects having to do with the corona of the Sun, which is constantly changing.)

But in the end, even though the shadow of the Moon on the Earth moves at more than 1000 mph, modern science successfully makes it possible to compute when the shadow will reach a particular point on Earth to an accuracy of perhaps a second. And that’s what our precisioneclipse.com website is set up to do.

Eclipse Experiences

Written August 15, 2017

I saw my first partial solar eclipse more than 50 years ago. And I’ve seen one total solar eclipse before in my life—in 1991. It was the longest eclipse (6 minutes 53 seconds) that’ll happen for more than a century.

There was a certain irony to my experience, though, especially in view of our efforts now to predict the exact arrival time of next week’s eclipse. I’d chartered a plane and flown to a small airport in Mexico (yes, that’s me on the left with the silly hat)—and my friends and I had walked to a beautiful deserted beach, and were waiting under a cloudless sky for the total eclipse to begin.

Click to enlarge

I felt proud of how prepared I was—with maps marking to the minute when the eclipse should arrive. But then I realized: there we were, out on a beach with no obvious signs of modern civilization—and nobody had brought any properly set timekeeping device (and in those days my cellphone was just a phone, and didn’t even have signal there).

And so it was that I missed seeing a demonstration of an impressive achievement of science. And instead I got to experience the eclipse pretty much the way people throughout history have experienced eclipses—even if I did know that the Moon would continue gradually eating into the Sun and eventually cover it, and that it wouldn’t make the world end.

There’s always something sobering about astronomical events, and about realizing just how tiny human scales are compared to them. Billions of eclipses have happened over the course of the Earth’s history. Recorded history has covered only a few thousand of them. On average, there’s an eclipse at any given place on Earth roughly every 400 years; in Jackson, WY, where I’m planning to see next week’s eclipse, it turns out the next total eclipse will be 727 years from now—in 2744.

In earlier times, civilizations built giant monuments to celebrate the motions of the Sun and Moon. Today, for the eclipse next week, what we’re making is a website. But that website builds on one of the great epics of human intellectual history—stretching back to the earliest times of systematic science, and encompassing contributions from a remarkable cross-section of the most celebrated scientists and mathematicians from past centuries.

It’ll be about 9538 days since the eclipse I saw in 1991. The Moon will have traveled some 500 million miles around the Earth, and the Earth some 15 billion miles around the Sun. But now—in a remarkable triumph of science—we’re computing to the second when they’ll be lined up again.

Written in Anticipation of April 8, 2024

In the days leading up to August 21, 2017, millions of people accessed our precisioneclipse.com website—with their geoIPs increasingly concentrating near the path of totality. I had traveled to Wyoming and—with a couple of hours to spare—found a place with a clear view across a valley. And this now being 2017, I tweeted:

Click to enlarge

But would our carefully done computations actually be accurate? The eclipse was going to make landfall on the Oregon coast, and, conveniently, we had a spotter right there. From where I was, the partial eclipse was well underway. And then I got a text: yes, totality in Oregon had come at the predicted second. It would take the shadow of the Moon a little under 20 minutes to reach me.

Unlike in 1991, I and everyone else had a cellphone with a precise clock—and was able to access our precisioneclipse.com site:

Click to enlarge

While I was waiting I was making little images of the crescent Sun with my fingers—repeating something I’d first noticed more than 50 years earlier when I saw my first partial eclipse at the age of 6:

Click to enlarge

A few minutes before the eclipse, I started to see a strange shimmering (invisible on any video I took): shadow bands, a strange and poorly understood eclipse phenomenon. And then, there it came, sweeping across the valley: totality. Arriving right at the predicted second:

Click to enlarge

I had set up a camera to capture a video of the eclipse, and a little later that day I did an analysis of it—and, since earlier in 2017 I’d started routinely doing livestreams, I livestreamed it:

Click to enlarge

At the end, I published my notebook to the Wolfram Cloud, and it’s still there:

Click to enlarge

And now six years have passed. Much has happened in our human world. But the Moon has just inexorably continued in its orbit. And 2422 days later, it will once again line up to create a total eclipse…

☑️ ☆

Can AI Solve Science?

Note: Click any diagram to get Wolfram Language code to reproduce it. Wolfram Language code for training the neural nets used here is also available (requires GPU).

Can AI Solve Science?

Won’t AI Eventually Be Able to Do Everything?

Particularly given its recent surprise successes, there’s a somewhat widespread belief that eventually AI will be able to “do everything”, or at least everything we currently do. So what about science? Over the centuries we humans have made incremental progress, gradually building up what’s now essentially the single largest intellectual edifice of our civilization. But despite all our efforts, there are still all sorts of scientific questions that remain. So can AI now come in and just solve all of them?

To this ultimate question we’re going to see that the answer is inevitably and firmly no. But that certainly doesn’t mean AI can’t importantly help the progress of science. At a very practical level, for example, LLMs provide a new kind of linguistic interface to the computational capabilities that we’ve spent so long building in the Wolfram Language. And through their knowledge of “conventional scientific wisdom” LLMs can often provide what amounts to very high-level “autocomplete” for filling in “conventional answers” or “conventional next steps” in scientific work.

But what I want to do here is to discuss what amount to deeper questions about AI in science. Three centuries ago science was transformed by the idea of representing the world using mathematics. And in our times we’re in the middle of a major transformation to a fundamentally computational representation of the world (and, yes, that’s what our Wolfram Language computational language is all about). So how does AI stack up? Should we think of it essentially as a practical tool for accessing existing methods, or does it provide something fundamentally new for science?

My goal here is to explore and assess what AI can and can’t be expected to do in science. I’m going to consider a number of specific examples, simplified to bring out the essence of what is (or isn’t) going on. I’m going to talk about intuition and expectations based on what we’ve seen so far. And I’m going to discuss some of the theoretical—and in some ways philosophical—underpinnings of what’s possible and what’s not.

So what do I actually even mean by “AI” here? In the past, anything seriously computational was often considered “AI”, in which case, for example, what we’ve done for so long with our Wolfram Language computational language would qualify—as would all my “ruliological” study of simple programs in the computational universe. But here for the most part I’m going to adopt a narrower definition—and say that AI is something based on machine learning (and usually implemented with neural networks), that’s been incrementally trained from examples it’s been given. Often I’ll add another piece as well: that those examples include either a large corpus of human-generated scientific text, etc., or a corpus of actual experience about things that happen in the world—or, in other words, that in addition to being a “raw learning machine” the AI is something that’s already learned from lots of human-aligned knowledge.

OK, so we’ve said what we mean by AI. So now what do we mean by science, and by “doing science”? Ultimately it’s all about taking things that are “out there in the world” (and usually the natural world) and having ways to connect or translate them to things we can think or reason about. But there are several, rather different, common “workflows” for actually doing science. Some center around prediction: given observed behavior, predict what will happen; find a model that we can explicitly state that says how a system will behave; given an existing theory, determine its specific implications. Other workflows are more about explanation: given a behavior, produce a human-understandable narrative for it; find analogies between different systems or models. And still other workflows are more about creating things: discover something that has particular properties; discover something “interesting”.

In what follows we’ll explore these workflows in more detail, seeing how they can (or cannot) be transformed—or informed—by AI. But before we get into this, we need to discuss something that looms over any attempt to “solve science”: the phenomenon of computational irreducibility.

The Hard Limit of Computational Irreducibility

Often in doing science there’s a big challenge in finding the underlying rules by which some system operates. But let’s say we’ve found those rules, and we’ve got some formal way to represent them, say as a program. Then there’s still a question of what those rules imply for the actual behavior of the system. Yes, we can explicitly apply the rules step by step and trace what happens. But can we—in one fell swoop—just “solve everything” and know how the system will behave?

To do that, we in a sense have to be “infinitely smarter” than the system. The system has to go through all those steps—but somehow we can “jump ahead” and immediately figure out the outcome. A key idea—ultimately supported at a foundational level by our Physics Project—is that we can think of everything that happens as a computational process. The system is doing a computation to determine its behavior. We humans—or, for that matter, any AIs we create—also have to do computations to try to predict or “solve” that behavior. But the Principle of Computational Equivalence says that these computations are all at most equivalent in their sophistication. And this means that we can’t expect to systematically “jump ahead” and predict or “solve” the system; it inevitably takes a certain irreducible amount of computational work to figure out what exactly the system will do. And so, try as we might, with AI or otherwise, we’ll ultimately be limited in our “scientific power” by the computational irreducibility of the behavior.

But given computational irreducibility, why is science actually possible at all? The key fact is that whenever there’s overall computational irreducibility, there are also an infinite number of pockets of computational reducibility. In other words, there are always certain aspects of a system about which things can be said using limited computational effort. And these are what we typically concentrate on in “doing science”.

But inevitably there are limits to this—and issues that run into computational irreducibility. Sometimes these manifest as questions we just can’t answer, and sometimes as “surprises” we couldn’t see coming. But the point is that if we want to “solve everything” we’ll inevitably be confronted with computational irreducibility, and there just won’t be any way—with AI or otherwise—to shortcut just simulating the system step by step.

There is, however, a subtlety here. What if all we ever want to know about are things that align with computational reducibility? A lot of science—and technology—has been constructed specifically around computationally reducible phenomena. And that’s for example why things like mathematical formulas have been able to be as successful in science as they have.

But we certainly know we haven’t yet solved everything we want in science. And in many cases it seems like we don’t really have a choice about what we need to study; nature, for example, forces it upon us. And the result is that we inevitably end up face-to-face with computational irreducibility.

As we’ll discuss, AI has the potential to give us streamlined ways to find certain kinds of pockets of computational reducibility. But there’ll always be computational irreducibility around, leading to unexpected “surprises” and things we just can’t quickly or “narratively” get to. Will this ever end? No. There’ll always be “more to discover”. Things that need more computation to reach. Pockets of computational reducibility that we didn’t know were there. And ultimately—AI or not—computational irreducibility is what will prevent us from ever being able to completely “solve science”.

There’s a curious historical resonance to all this. Back at the beginning of the twentieth century, there was a big question of whether all of mathematics could be “mechanically solved”. The arrival of Gödel’s theorem, however, seemed to establish that it could not. And now that we know that science also ultimately has a computational structure, the phenomenon of computational irreducibility—which is, in effect, a sharpening of Gödel’s theorem—shows that it too cannot be “mechanically solved”.

We can still ask, though, whether the mathematics—or science—that humans choose to study might manage to live solely in pockets of computational reducibility. But in a sense the ultimate reason that “math is hard” is that we’re constantly seeing evidence of computational irreducibility: we can’t get around actually having to compute things. Which is, for example, not what methods like neural net AI (at least without the help of tools like Wolfram Language) are good at.

Things That Have Worked in the Past

Before getting into the details of what modern machine-learning-based AI might be able to do in “solving science”, it seems worthwhile to recall some of what’s worked in the past—not least as a kind of baseline for what modern AI might now be able to add.

I myself have been using computers and computation to discover things in science for more than four decades now. My first big success came in 1981 when I decided to try enumerating all possible rules of a certain kind (elementary cellular automata) and then ran them on a computer to see what they did:

I’d assumed that with simple underlying rules, the final behavior would be correspondingly simple. But in a sense the computer didn’t assume that: it just enumerated rules and computed results. And so even though I never imagined it would be there, it was able to “discover” something like rule 30.

Over and over again I have had similar experiences: I can’t see how some system can manage to do anything “interesting”. But when I systematically enumerate possibilities, there it is: something unexpected, interesting—and “clever”—effectively discovered by computer.

In the early 1990s I wondered what the simplest possible universal Turing machine might be. I would never have been able to figure it out myself. The machine that had held the record since the early 1960s had 7 states and 4 colors. But the computer let me discover just by systematic enumeration the 2-state, 3-color machine

that in 2007 was proved universal (and, yes, it’s the simplest possible universal Turing machine).

In 2000 I was interested in what the simplest possible axiom system for logic (Boolean algebra) might be. The simplest known up to that time involved 9 binary (Nand) operations. But by systematically enumerating possibilities, I ended up finding the single 6-operation axiom (which I proved correct using automated theorem proving). Once again, I had no idea this was “out there”, and certainly I would never have been able to construct it myself. But just by systematic enumeration the computer was able to find what seemed to me like a very “creative” result.

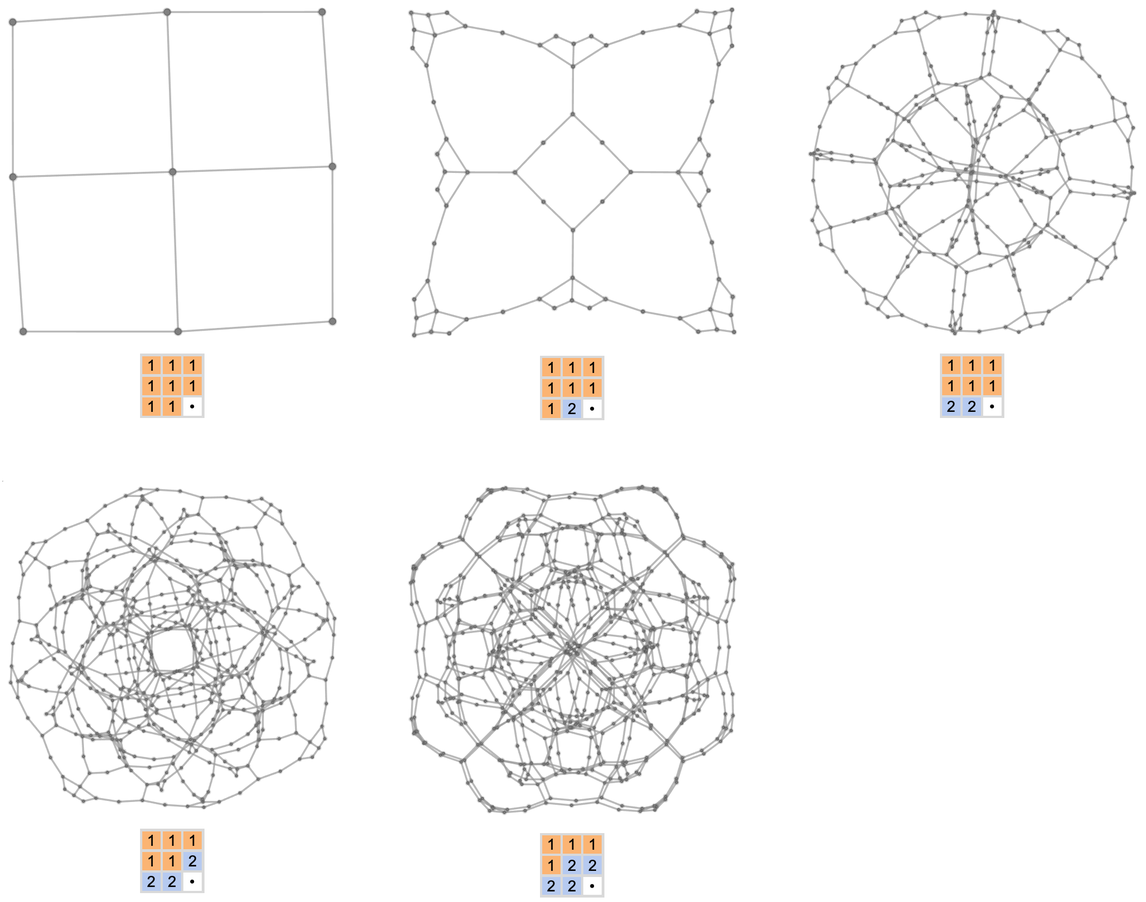
In 2019 I was doing another systematic enumeration, now of possible hypergraph rewriting rules that might correspond to the lowest-level structure of our physical universe. When I looked at the geometries that were generated I felt like as a human I could roughly classify what I saw. But were there outliers? I turned to something closer to “modern AI” to do the science—making a feature space plot of visual images:

Feature space plot of visual images

It needed me as a human to interpret it, but, yes, there were outliers that had effectively been “automatically discovered” by the neural net that was making the feature space plot.

I’ll give one more example—of a rather different kind—from my personal experience. Back in 1987—as part of building Version 1.0 of what’s now Wolfram Language—we were trying to develop algorithms to compute hundreds of mathematical special functions over very broad ranges of arguments. In the past, people had painstakingly computed series approximations for specific cases. But our approach was to use what amounts to machine learning, burning months of computer time fitting parameters in rational approximations. Nowadays we might do something similar with neural nets rather than rational approximations. But in both cases the concept is to find a general model of the “world” one’s dealing with (here, values of special functions)—and try to learn the parameters in the model from actual data. It’s not exactly “solving science”, and it wouldn’t even allow one to “discover the unexpected”. But it’s a place where “AI-like” knowledge of general expectations about smoothness or simplicity lets one construct the analog of a scientific model.

Can AI Predict What Will Happen?

It’s not the only role of science—and in the sections that follow we’ll explore others. But historically what’s often been viewed as a defining feature of successful science is: can it predict what will happen? So now we can ask: does AI give us a dramatically better way to do this?

In the simplest case we basically want to use AI to do inductive inference. We feed in the results of a bunch of measurements, then ask the AI to predict the results of measurements we haven’t yet done. At this level, we’re treating the AI as a black box; it doesn’t matter what’s happening inside; all we care about is whether the AI gives us the right answer. We might think that somehow we can set up the AI up so that it “isn’t making any assumptions”—and is just “following the data”. But it’s inevitable that there’ll be some underlying structure in the AI, that makes it ultimately assume some kind of model for the data.

Yes, there can be a lot of flexibility in this model. But one can’t have a truly “model-less model”. Perhaps the AI is based on a huge neural network, with billions of numerical parameters that can get tweaked. Perhaps even the architecture of the network can change. But the whole neural net setup inevitably defines an ultimate underlying model.

Let’s look at a very simple case. Let’s imagine our “data” is the blue curve here—perhaps representing the motion of a weight suspended on a spring—and that the “physics” tells us it continues with the red curve:

Now let’s take a very simple neural net

and let’s train it using the “blue curve” data above to get a network with a certain collection of weights:

Now let’s apply this trained network to reproduce our original data and extend it:

And what we see is that the network does a decent job of reproducing the data it was trained on, but when it comes to “predicting the future” it basically fails.

So what’s going on here? Did we just not train long enough? Here’s what happens with progressively more rounds of training:

It doesn’t seem like this helps much. So maybe the problem is that our network is too small. Here’s what happens with networks having a series of sizes:

And, yes, larger sizes help. But they don’t solve the problem of making our prediction successful. So what else can we do? Well, one feature of the network is its activation function: how we determine the output at each node from the weighted sum of inputs. Here are some results with various (popular) activation functions:

And there’s something notable here—that highlights the idea that there are “no model-less models”: different activation functions lead to different predictions, and the form of the predictions seems to be a direct reflection of the form of the activation function. And indeed there’s no magic here; it’s just that the neural net corresponds to a function whose core elements are activation functions.

So, for example, the network

corresponds to the function

where ϕ represents the activation function used in this case.

Of course, the idea of approximating one function by some combination of standard functions is extremely old (think: epicycles and before). Neural nets allow one to use more complicated (and hierarchical) combinations of more complicated and nonlinear functions, and provide a more streamlined way of “fitting all the parameters” that are involved. But at a fundamental level it’s the same idea.

And for example here are some approximations to our “data” constructed in terms of more straightforward mathematical functions:

These have the advantage that it’s quite easy to state “what each model is” just by “giving its formula”. But just as with our neural nets, there are problems in making predictions.

(By the way, there are a whole range of methods for things like time series prediction, involving ideas like “fitting to recurrence relations”—and, in modern times, using transformer neural nets. And while some of these methods happen to be able to capture a periodic signal like a sine wave well, one doesn’t expect them to be broadly successful in accurately predicting functions.)

OK, one might say, perhaps we’re trying to use—and train—our neural nets in too narrow a way. After all, it seems as if it was critical to the success of ChatGPT to have a large amount of training data about all kinds of things, not just some narrow specific area. Presumably, though, what that broad training data did was to let ChatGPT learn the “general patterns of language and common sense”, which it just wouldn’t be able to pick up from narrower training data.

So what’s the analog for us here? It might be that we’d want our neural net to have a “general idea of how functions work”—for example to know about things like continuity of functions, or, for that matter, periodicity or symmetry. So, yes, we can go ahead and train not just on a specific “window” of data like we did above, but on whole families of functions—say collections of trigonometric functions, or perhaps all the built-in mathematical functions in the Wolfram Language.

And, needless to say, if we do this, we’ll surely be able to successfully predict our sine curve above—just as we would if we were using traditional Fourier analysis with sine curves as our basis. But is this “doing science”?

In essence it’s saying, “I’ve seen something like this before, so I figure this is what’s going to happen now”. And there’s no question that can be useful; indeed it’s an automated version of a typical thing that a human experienced in some particular area will be able to do. We’ll return to this later. But for now the main point is that at least when it comes to things like predicting functions, it doesn’t seem as if neural nets—and today’s AIs—can in any obvious way “see further” than what goes into their construction and training. There’s no “emergent science”; it’s just fairly direct “pattern matching”.

Predicting Computational Processes

Predicting a function is a particularly austere task and one might imagine that “real processes”—for example in nature—would have more “ambient structure” which an AI could use to get a “foothold” for prediction. And as an example of what we might think of as “artificial nature” we can consider computational systems like cellular automata. Here’s an example of what a particular cellular automaton rule does, with a particular initial condition:

There’s a mixture here of simplicity and complexity. And as humans we can readily predict what’s going to happen in the simple parts, but basically can’t say much about the other parts. So how would an AI do?

Clearly if our “AI” can just run the cellular automaton rule then it will be able to predict everything, though with great computational effort. But the real question is whether an AI can shortcut things to make successful predictions without doing all that computational work—or, put another way, whether the AI can successfully find and exploit pockets of computational reducibility.

So, as a specific experiment, let’s set up a neural net to try to efficiently predict the behavior of our cellular automaton. Our network is basically a straightforward—though “modern”—convolutional autoencoder, with 59 layers and a total of about 800,000 parameters:

It’s trained much like an LLM. We got lots of examples of the evolution of our cellular automaton, then we showed the network the “top half” of each one, and tried to get it to successfully continue this, to predict the “bottom half”. In the specific experiment we did, we gave 32 million examples of 64-cell-wide cellular automaton evolution. (And, yes, this number of examples is tiny compared to all possible initial configurations.) Then we tried feeding in “chunks” of cellular automaton evolution 64 cells wide and 64 steps long—and looked to see what probabilities the network assigned to different possible continuations.

Here are some results for a sequence of different initial conditions:

And what we see is what we might expect: when the behavior is simple enough, the network basically gets it right. But when the behavior is more complicated, the network usually doesn’t do so well with it. It still often gets it at least “vaguely right”—but the details aren’t there.

Perhaps, one might think, the network just wasn’t trained for long enough, or with enough examples. And to get some sense of the effect of more training, here’s how the predicted probabilities evolve with successive quarter million rounds of training:

These should be compared to the exact result:

And, yes, with more training there is improvement, but by the end it seems like it probably won’t get much better. (Though its loss curve does show some sudden downward jumps during the course of training, presumably as “discoveries” are made—and we can’t be sure there won’t be more of these.)

It’s extremely typical of machine learning that it manages to do a good job of getting things “roughly right”. But nailing the details is not what machine learning tends to be good at. So when what one’s trying to do depends on that, machine learning will be limited. And in the prediction task we’re considering here, the issue is that once things go even slightly off track, everything basically just gets worse from there on out.

Identifying Computational Reducibility

Computational reducibility is at the center of what we normally think of as “doing science”. Because it’s not only responsible for letting us make predictions, it’s also what lets us identify regularities, make models and compressed summaries of what we see—and develop understanding that we can capture in our minds.

But how can we find computational reducibility? Sometimes it’s very obvious. Like when we make a visualization of some behavior (like the cellular automaton evolution above) and immediately recognize simple features in it. But in practice computational reducibility may not be so obvious, and we may have to dig through lots of details to find it. And this is a place where AI can potentially help a lot.

At some level we can think of it as a story of “finding the right parametrization” or the “right coordinate system”. As a very straightforward example, consider the seemingly quite random cloud of points:

Just turning this particular cloud of points to the appropriate angle reveals obvious regularities:

But is there a general way to pick out regularities if they’re there? There’s traditional statistics (“Is there a correlation between A and B?”, etc.). There’s model fitting (“Is this a sum of Gaussians?”). There’s traditional data compression (“Is it shorter after run-length encoding?”). But all of these pick out only rather specific kinds of regularities. So can AI do more? Can it perhaps somehow provide a general way to find regularities?

To say one’s found a regularity in something is basically equivalent to saying one doesn’t need to specify all the details of the thing: that there’s a reduced representation from which one can reconstruct it. So, for example, given the “points-lie-on-lines” regularity in the picture above, one doesn’t need to separately specify the positions of all the points; one just needs to know that they form stripes with a certain separation.

OK, so let’s imagine we have an image with a certain number of pixels. We can ask whether there’s reduced representation that involves less data—from which the image can effectively be reconstructed. And with neural nets there’s what one might think of as a trick for finding such a reduced representation.

The basic idea is to set up a neural net as an autoencoder that takes inputs and reproduces them as outputs. One might think this would be a trivial task. But it’s not, because the data from the input has to flow through the innards of the neural net, effectively being “ground up” at the beginning and “reconstituted” at the end. But the point is that with enough examples of possible inputs, it’s potentially possible to train the neural net to successfully reproduce inputs, and operate as an autoencoder.

But now the idea is to look inside the autoencoder, and to pull out a reduced representation that it’s come up with. As data flows from layer to layer in the neural net, it’s always trying to preserve the information it needs to reproduce the original input. And if a layer has fewer elements, what’s present at that layer must correspond to some reduced representation of the original input.

Let’s start with a standard modern image autoencoder, that’s been trained on a few billion images typical of what’s on the web. Feed it a picture of a cat, and it’ll successfully reproduce something that looks like the original picture:

But in the middle there’ll be a reduced representation, with many fewer pixels—that somehow still captures what’s needed of the cat (here shown with its 4 color channels separated):

We can think of this as a kind of “black-box model” for the cat image. We don’t know what the elements (“features”) in the model mean, but somehow it’s successfully capturing “the essence of the picture”.

So what happens if we apply this to “scientific data”, or for example “artificial natural processes” like cellular automata? Here’s a case where we get successful compression:

In this case it’s not quite so successful:

And in these cases—where there’s underlying computational irreducibility—it has trouble:

But there’s a bit more to this story. You see, the autoencoder we’re using was trained on “everyday images”, not these kinds of “scientific images”. So in effect it’s trying to model our scientific images in terms of constructs like eyes and ears that are common in pictures of things like cats.

So what happens if—like in the case of cellular automaton prediction above—we train an autoencoder more specifically on the kinds of images we want?

Here are two very simple neural nets that we can use as an “encoder” and a “decoder” to make an autoencoder:

Now let’s take the standard MNIST image training set, and use these to train the autoencoder:

Each of these images has 28×28 pixels. But in the middle of the autoencoder we have a layer with just two elements. So this means that whatever we ask it to encode must be reduced to just two numbers:

And what we see here is that at least for images that look more or less like the ones it was trained on, the autoencoder manages to reconstruct something that looks at least roughly right, even from the radical compression. If you give it other kinds of images, however, it won’t be as successful, instead basically just insisting on reconstructing them as looking like images from its training set:

OK, so what about training it on cellular automaton images? Let’s take 10 million images generated with a particular rule:

Now we train our autoencoder on these images. Then we try feeding it similar images:

The results are at best very approximate; this small neural net didn’t manage to learn the “detailed ways of this particular cellular automaton”. If it had been successful at characterizing all the apparent complexity of the cellular automaton evolution with just two numbers, then we could have considered this an impressive piece of science. But, unsurprisingly, the neural net was effectively blocked by computational irreducibility.

But even though it can’t “seriously crack computational irreducibility” the neural net can still “make useful discoveries”, in effect by finding little pieces of computational reducibility, and little regularities. So, for example, if we take images of “noisy letters” and use a neural net to reduce them to pairs of numbers, and use these numbers to place the images, we get a “dimension-reduced feature space plot” that separates images of different letters:

But consider, for example, a collection of cellular automata with different rules:

Here’s how a typical neural net would arrange these images in “feature space”:

And, yes, this has almost managed to automatically discover the four classes of behavior that I identified in early 1983. But it’s not quite there. Though in a sense this is a difficult case, very much face-to-face with computational irreducibility. And there are plenty of cases (think: arrangement of the periodic table based on element properties; similarity of fluid flows based on Reynolds number; etc.) where one can expect a neural net to key into pockets of computational reducibility and at least successfully recapitulate existing scientific discoveries.

AI in the Non-human World

In its original concept AI was about developing artificial analogs of human intelligence. And indeed the recent great successes of AI—say in visual object recognition or language generation—are all about having artificial systems that reproduce the essence of what humans do. It’s not that there’s a precise theoretical definition of what makes an image be of a cat versus of a dog. What matters is that we can have a neural net that will come to the same conclusions as humans do.

So why does this work? Probably it’s because neural nets capture the architectural essence of actual brains. Of course the details of artificial neural networks aren’t the same as biological brains. But in a sense the big surprise of modern AI is that there seems to be enough universality to make artificial neural nets behave in ways that are functionally similar to human brains, at least when it comes to things like visual object recognition or language generation.

But what about questions in science? At one level we can ask whether neural nets can emulate what human scientists do. But there’s also another level: is it possible that neural nets can just directly work out how systems—say in nature—behave? Imagine we’re studying some physical process. Human scientists might find some human-level description of the system, say in terms of mathematical equations. But the system itself is just directly doing what it does. And the question is whether that’s something a neural net can capture.

And if neural nets “work” on “human-like tasks” only because they’re architecturally similar to brains, there’s no immediate reason to think that they should be able to capture “raw natural processes” that aren’t anything to do with brains. So what’s going on when AI does something like predicting protein folding?

One part of the story, I suspect, is that even though the physical process of protein folding has nothing to do with humans, the question of what aspects of it we consider significant does. We don’t expect that the neural net will predict the exact position of every atom (and in natural environments the atoms in a protein don’t even have precisely fixed positions). Instead, we want to know things like whether the protein has the “right general shape”, with the right “identifiable features” (like, say, alpha helices), or the right functional properties. And these are now more “human” questions—more in the “eye of the beholder”—and more like a question such as whether we humans judge an image to be of a cat versus a dog. So if we conclude that a neural net “solves the scientific problem” of how a protein folds, it might be at least in part just because the criteria of success that our brains (“subjectively”) apply is something that a neural net—with its brain-like architecture—happens to be able to deliver.

It’s a bit like producing an image with generative AI. At the level of basic human visual perception, it may look like something we recognize. But if we scrutinize it, we can see that it’s not “objectively” what we think it is:

It wasn’t ever really practical with “first-principles physics” to figure out how proteins fold. So the fact that neural nets can get even roughly correct answers is impressive. So how do they do it? A significant part of it is surely effectively just matching chunks of protein to what’s in the training set—and then finding “plausible” ways to “stitch” these chunks together. But there’s probably something else too. One’s familiar with certain “pieces of regularity” in proteins (things like alpha helices and beta sheets). But it seems likely that neural nets are effectively plugging into other kinds of regularity; they’ve somehow found pockets of reducibility that we didn’t know were there. And particularly if just a few pockets of reducibility show up over and over again, they’ll effectively represent new, general “results in science” (say, some new kind of commonly occurring “meta-motif” in protein structure).

But while it’s fundamentally inevitable that there must be an infinite number of pockets of computational reducibility in the end, it’s not clear at the outset either how significant these might be in things we care about, or how successful neural net methods might be in finding them. We might imagine that insofar as neural nets mirror the essential operation of our brains, they’d only be able to find pockets of reducibility in cases where we humans could also readily discover them, say by looking at some visualization or another.

But an important point is that our brains are normally “trained” only on data that we readily experience with our senses: we’ve seen the equivalent of billions of images, and we’ve heard zillions of sounds. But we don’t have direct experience of the microscopic motions of molecules, or of a multitude of kinds of data that scientific observations and measuring devices can deliver.

A neural net, however, can “grow up” with very different “sensory experiences”—say directly experiencing “chemical space”, or, for that matter “metamathematical space”, or the space of financial transactions, or interactions between biological organisms, or whatever. But what kinds of pockets of computational reducibility exist in such cases? Mostly we don’t know. We know the ones that correspond to “known science”. But even though we can expect others must exist, we don’t normally know what they are.

Will they be “accessible” to neural nets? Again, we don’t know. Quite likely, if they are accessible, then there’ll be some representation—or, say, visualization—in which the reducibility will be “obvious” to us. But there are plenty of ways this could fail. For example, the reducibility could be “visually obvious”, but only, say, in 3D volumes where, for example, it’s hard even to distinguish different structures of fluffy clouds. Or perhaps the reducibility could be revealed only through some computation that’s not readily handled by a neural net.

Inevitably there are many systems that show computational irreducibility, and which—at least in their full form—must be inaccessible to any “shortcut method”, based on neural nets or otherwise. But what we’re asking is whether, when there is a pocket of computational reducibility, it can be captured by a neural net.

But once again we’re confronted with the fact there are no “model-less models”. Some particular kind of neural net will readily be able to capture some particular kinds of computational reducibility; another will readily be able to capture others. And, yes, you can always construct a neural net that will approximate any given specific function. But in capturing some general kind of computational reducibility, we are asking for much more—and what we can get will inevitably depend on the underlying structure of the neural net.

But let’s say we’ve got a neural net to successfully key into computational reducibility in a particular system. Does that mean it can predict everything? Typically no. Because almost always the computational reducibility is “just a pocket”, and there’s plenty of computational irreducibility—and “surprises”—“outside”.

And indeed this seems to happen even in the case of something like protein folding. Here are some examples of proteins with what we perceive as fairly simple structures—and the neural net prediction (in yellow) agrees quite well with the results of physical experiments (gray tubes):

But for proteins with what we perceive as more complicated structures, the agreement is often not nearly as good:

These proteins are all are at least similar to ones that were used to train the neural net. But how about very different proteins—say ones with random sequences of amino acids?

It’s hard to know how well the neural net does here; it seems likely that particularly if there are “surprises” it won’t successfully capture them. (Of course, it could be that all “reasonable proteins” that normally appear in biology could have certain features, and it could be “unfair” to apply the neural net to “unbiological” random ones—though for example in the adaptive immune system, biology does effectively generate at least short “random proteins”.)

Solving Equations with AI

In traditional mathematical science the typical setup is: here are some equations for a system; solve them to find out how the system behaves. And before computers, that usually meant that one had to find some “closed-form” formula for the solution. But with computers, there’s an alternative approach: make a discrete “numerical approximation”, and somehow incrementally solve the equations. To get accurate results, though, may require many steps and lots of computational effort. So then the question is: can AI speed this up? And in particular, can AI, for example, go directly from initial conditions for an equation to a whole solution?

Let’s consider as an example a classical piece of mathematical physics: the three-body problem. Given initial positions and velocities of three point masses interacting via inverse-square-law gravity, what trajectories will the masses follow? There’s a lot of diversity—and often a lot of complexity—which is why the three-body problem has been such a challenge:

But what if we train a neural net on lots of sample solutions? Can it then figure out the solution in any particular case? We’ll use a rather straightforward “multilayer perceptron” network:

We feed it initial conditions, then ask it to generate a solution. Here are a few examples of what it does, with the correct solutions indicated by the lighter background paths:

When the trajectories are fairly simple, the neural net does decently well. But when things get more complicated, it does decreasingly well. It’s as if the neural net has “successfully memorized” the simple cases, but doesn’t know what to do in more complicated cases. And in the end this is very similar to what we saw above in examples like predicting cellular automaton evolution (and presumably also protein folding).

And, yes, once again this is a story of computational irreducibility. To ask to just “get the solution” in one go is to effectively ask for complete computational reducibility. And insofar as one might imagine that—if only one knew how to do it—one could in principle always get a “closed-form formula” for the solution, one’s implicitly assuming computational reducibility. But for many decades I’ve thought that something like the three-body problem is actually quite full of computational irreducibility.

Of course, had a neural net been able to “crack the problem” and immediately generate solutions, that would effectively have demonstrated computational reducibility. But as it is, the apparent failure of neural nets provides another piece of evidence for computational irreducibility in the three-body problem. (It’s worth mentioning, by the way, that while the three-body problem does show sensitive dependence on initial conditions, that’s not the primary issue here; rather, it’s the actual intrinsic complexity of the trajectories.)

We already know that discrete computational systems like cellular automata are rife with computational irreducibility. And we might have imagined that continuous systems—described for example by differential equations—would have more structure that would somehow make them avoid computational irreducibility. And indeed insofar as neural nets (in their usual formulation) involve continuous numbers, we might have thought that they would be able in some way to key into the structure of continuous systems to be able to predict them. But somehow it seems as if the “force of computational irreducibility” is too strong, and will ultimately be beyond the power of neural networks.

Having said that, though, there can still be a lot of practical value to neural networks in doing things like solving equations. Traditional numerical approximation methods tend to work locally and incrementally (if often adaptively). But neural nets can more readily handle “much larger windows”, in a sense “knowing longer runs of behavior” and being able to “jump ahead” across them. In addition, when one’s dealing with very large numbers of equations (say in robotics or systems engineering), neural nets can typically just “take in all the equations and do something reasonable” whereas traditional methods effectively have to work with the equations one by one.

The three-body problem involves ordinary differential equations. But many practical problems are instead based on partial differential equations (PDEs), in which not just individual coordinates, but whole functions f[x] etc., evolve with time. And, yes, one can use neural nets here as well, often to significant practical advantage. But what about computational irreducibility? Many of the equations and situations most studied in practice (say for engineering purposes) tend to avoid it, but certainly in general it’s there (notably, say, in phenomena like fluid turbulence). And when there’s computational irreducibility, one can’t ultimately expect neural nets to do well. But when it comes to satisfying our human purposes—as in other examples we’ve discussed—things may look better.

As an example, consider predicting the weather. In the end, this is all about PDEs for fluid dynamics (and, yes, there are also other effects to do with clouds, etc.). And as one approach, one can imagine directly and computationally solving these PDEs. But another approach would be to have a neural net just “learn typical patterns of weather” (as old-time meteorologists had to), and then have the network (a bit like for protein folding) try to patch together these patterns to fit whatever situation arises.

How successful will this be? It’ll probably depend on what we’re looking at. It could be that some particular aspect of the weather shows considerable computational reducibility and is quite predictable, say by neural nets. And if this is the aspect of the weather that we care about, we might conclude that the neural net is doing well. But if something we care about (“will it rain tomorrow?”) doesn’t tap into a pocket of computational reducibility, then neural nets typically won’t be successful in predicting it—and instead there’d be no choice but to do explicit computation, and perhaps impractically much of it.

AI for Multicomputation

In what we’ve discussed so far, we’ve mostly been concerned with seeing whether AI can help us “jump ahead” and shortcut some computational process or another. But there are also lots of situations where what’s of interest is instead to shortcut what one can call a multicomputational process, in which there are many possible outcomes at each step, and the goal is for example to find a path to some final outcome.

As a simple example of a multicomputational process, let’s consider a multiway system operating on strings, where at each step we apply the rules {A BBB, BB A} in all possible ways:

Given this setup we can ask a question like: what’s the shortest path from A to BABA? And in the case shown here it’s easy to compute the answer, say by explicitly running a pathfinding algorithm on the graph:

There are many kinds of problems that follow this same general pattern. Finding a winning sequence of plays in a game graph. Finding the solution to a puzzle as a sequence of moves through a graph of possibilities. Finding a proof of a theorem given certain axioms. Finding a chemical synthesis pathway given certain basic reactions. And in general solving a multitude of NP problems in which many “nondeterministic” paths of computation are possible.

In the very simple example above, we’re readily able to explicitly generate a whole multiway graph. But in most practical examples, the graph would be astronomically too large. So the challenge is typically to suss out what moves to make without tracing the whole graph of possibilities. One common approach is to try to find a way to assign a score to different possible states or outcomes, and to pursue only paths with (say) the highest scores. In automated theorem proving it’s also common to work “downward from initial propositions” and “upward from final theorems”, trying to see where the paths meet in the middle. And there’s also another important idea: if one has established the “lemma” that there’s a path from X to Y, one can add X Y as a new rule in the collection of rules.

So how might AI help? As a first approach, we could consider taking something like our string multiway system above, and training what amounts to a language-model AI to generate sequences of tokens that represent paths (or what in a mathematical setting would be proofs). The idea is to feed the AI a collection of valid sequences, and then to present it with the beginning and end of a new sequence, and ask it to fill in the middle.

We’ll use a fairly basic transformer network:

Then we train it by giving lots of sequences of tokens corresponding to valid paths (with E being the “end token”)

together with “negative examples” indicating the absence of paths:

Now we “prompt” the trained network with a “prefix” of the kind that appeared in the training data, and then iteratively run “LLM style” (effectively at zero temperature, i.e. always choosing the “most probable” next token):

For a while, it does perfectly—but near the end it starts making errors, as indicated by the tokens shown in red. There’s different performance with different destinations—with some cases going off track right at the beginning:

How can we do better? One possibility is at each step to keep not just the token that’s considered most probable, but a stack of tokens—thereby in effect generating a multiway system that the “LLM controller” could potentially navigate. (One can think of this somewhat whimsically as a “quantum LLM”, that’s always exploring multiple paths of history.)

(By the way, we could also imagine training with many different rules, then doing what amounts to zero-shot learning and giving a “pre-prompt” that specifies what rule we want to use in any particular case.)

One of the issues with this LLM approach is that the sequences it generates are often even “locally wrong”: the next element can’t follow from the one before according to the rules given.

But this suggests another approach one can take. Instead of having the AI try to “immediately fill in the whole sequence”, get it instead just to pick “where to go next”, always following one of the specified rules. Then a simple goal for training is in effect to get the AI to learn the distance function for the graph, or in other words, to be able to estimate how long the shortest path is (if it exists) from any one node to any other. Given such a function, a typical strategy is to follow what amounts to a path of “steepest descent”—at each step picking the move that the AI estimates will do best in reducing the distance to the destination.

How can this actually be implemented with neural networks? One approach is to use two encoders (say constructed out of transformers)—that in effect generate two embeddings, one for source nodes, and one for destination nodes. The network then combines these embeddings and learns a “metric” that characterizes the distance between the nodes:

Training such a network on the multiway system we’ve been discussing—by giving it a few million examples of source-destination distances (plus an indicator of whether this distance is infinite)—we can use the network to predict a piece of the distance matrix for the multiway system. And what we find is that this predicted matrix is similar—but definitely not identical—to the actual matrix:

Still, we can imagine trying to build a path where at each step we compute the estimated distances-to-destination predicted by the neural net for each possible destination, then pick the one that “gets furthest”:

Each individual move here is guaranteed to be valid, and we do indeed eventually reach our destination BABA—though in slightly more steps than the true shortest path. But even though we don’t quite find the optimal path, the neural net has managed to allow us to at least somewhat prune our “search space”, by prioritizing nodes and traversing only the red edges:

(A technical point is that the particular neural net we’ve used here has the property that all paths between any given pair of nodes always have the same length—so if any path is found, it can be considered “the shortest”. A rule like {A AAB, BBA B} doesn’t have this property and a neural net trained for this rule can end up finding paths that reach the correct destination but aren’t as short as they could be.)

Still, as is typical with neural nets, we can’t be sure how well this will work. The neural net might make us go arbitrarily far “off track”, and it might even lead us to a node where we have no path to our destination—so that if we want to make progress we’ll have to resort to something like traditional algorithmic backtracking.

But at least in simple cases the approach can potentially work well—and the AI can successfully find a path that wins the game, proves the theorem, etc. But one can’t expect it to always work. And the reason is that it’s going to run into multicomputational irreducibility. Just as in a single “thread of computation” computational irreducibility can mean that there’s no shortcut to just “going through the steps of the computation”, so in a multiway system multicomputational irreducibility can mean that there’s no shortcut to just “following all the threads of computation”, then seeing, for example, which end up merging with which.

But even though this could happen in principle, does it in fact happen in practice in cases of interest to us humans? In something like games or puzzles, we tend to want it to be hard—but not too hard—to “win”. And when it comes to mathematics and proving theorems, cases that we use for exercises or competitions we similarly want to be hard, but not too hard. But when it comes to mathematical research, and the frontiers of mathematics, one doesn’t immediately expect any such constraint. And the result is then that one can expect to be face-to-face with multicomputational irreducibility—making it hard for AI to help too much.

There is, however, one footnote to this story, and it has to do with how we choose new directions in mathematics. We can think of a metamathematical space formed by building up theorems from other theorems in all possible ways in a giant multiway graph. But as we’ll discuss below, most of the details of this are far from what human mathematicians would think of as “doing mathematics”. Instead, mathematicians implicitly seem to do mathematics at a “higher level” in which they’ve “coarse grained” this “microscopic metamathematics”—much as we might study a physical fluid in terms of comparatively-simple-to-describe continuous dynamics even though “underneath” there are lots of complicated molecular motions.

So can AI help with mathematics at this “fluid-dynamics-style” level? Potentially so, but mainly in what amounts to providing code assistance. We have something we want to express, say, in Wolfram Language. But we need help—“LLM style”—in going from our informal conception to explicit computational language. And insofar as what we’re doing follows the structural patterns of what’s been done before, we can expect something like an LLM to help. But insofar as what we’re expressing is “truly new”, and inasmuch as our computational language doesn’t involve much “boilerplate”, it’s hard to imagine that an AI trained on what’s been done before will help much. Instead, what we in effect have to do is some multicomputationally irreducible computation, that allows us to explore to some fresh part of the computational universe and the ruliad.

Exploring Spaces of Systems

“Can one find a system that does X?” Say a Turing machine that runs for a very long time before halting. Or a cellular automaton that grows, but only very slowly. Or, for that matter, a chemical with some particular property.

This is a somewhat different type of question than the ones we’ve been discussing so far. It’s not about taking a particular rule and seeing what its consequences are. It’s about identifying what rule might exist that has certain consequences.

And given some space of possible rules, one approach is exhaustive search. And in a sense this is ultimately the only “truly unbiased” approach, that will discover what’s out there to discover, even when one doesn’t expect it. Of course, even with exhaustive search, one still needs a way to determine whether a particular candidate system meets whatever criterion one has set up. But now this is the problem of predicting a computation—where the things we said above apply.

OK, but can we do better than exhaustive search? And can we, for example, find a way to figure out what rules to explore without having to look at every rule? One approach is to do something like what happens in biological evolution by natural selection: start, say, from a particular rule, and then incrementally change it (perhaps at random), at every step keeping the rule or rules that do best, and discarding the others.

This isn’t “AI” as we’ve operationally defined it here (it’s more like a “genetic algorithm”)—though it is a bit like the inner training loop of a neural net. But will it work? Well, that depends on the structure of the rule space—and, as one sees in machine learning—it tends to work better in higher-dimensional rule spaces than lower-dimensional ones. Because with more dimensions there’s less chance one will get “stuck in a local minimum”, unable to find one’s way out to a “better rule”.

And in general, if the rule space is like a complicated fractal mountainscape, it’s reasonable to expect one can make progress incrementally (and perhaps AI methods like reinforcement learning can help refine what incremental steps to take). But if instead it’s quite flat, with, say, just one “hole” somewhere (“golf-course style”), one can’t expect to “find the hole” incrementally. So what is the typical structure of rule spaces? There are certainly plenty of cases where the rule space is altogether quite large, but the number of dimensions is only modest. And in such cases (an example being finding small Turing machines with long halting times) there often seem to be “isolated solutions” that can’t be reached incrementally. But when there are more dimensions, it seems likely that what amounts to computational irreducibility will more or less guarantee that there’ll be a “random-enough landscape” that incremental methods will be able to do well, much as we have seen in machine learning in recent years.

So what about AI? Might there be a way for AI to learn how to “pick winners directly in rule space”, without any kind of incremental process? Might we perhaps be able to find some “embedding space” in which the rules we want are laid out in a simple way—and thus effectively “pre-identified” for us? Ultimately it depends on what the rule space is like, and whether the process of exploring it is necessarily (multi)computationally irreducible, or whether at least the aspects of it that we care about can be explored by a computationally reducible process. (By the way, trying to use AI to directly find systems with particular properties is a bit like trying to use AI to directly generate neural nets from data without incremental training.)

Let’s look at a specific simple example based on cellular automata. Say we want to find a cellular automaton rule that—when evolved from a single-cell initial condition—will grow for a while, but then die out after a particular, exact number of steps. We can try to solve this with a very minimal AI-like “evolutionary” approach: start from a random rule, then at each “generation” produce a certain number of “offspring” rules, each with one element randomly changed—then keep whichever is the “best” of these rules. If we want to find a rule that “lives” for exactly 50 steps, we define “best” to be the one that minimizes a “loss function” equal to the distance from 50 of the number of steps a rule actually “lives”.

So, for example, say we start from the randomly chosen (3-color) rule:

Our evolutionary sequence of rules (showing here only the “outcome values”) might be:

If we look at the behavior of these rules, we see that—after an inauspicious start—they manage to successfully evolve to reach a rule that meets the criterion of “living for exactly 50 steps”:

What we’ve shown here is a particular randomly chosen “path of evolution”. But what happens with other paths? Here’s how the “loss” evolves (over the course of 100 generations) for a collection of paths:

And what we see is that there’s only one “winner” here that achieves zero loss; on all the other paths, evolution “gets stuck”.

As we mentioned above, though, with more “dimensions” one’s less likely to get stuck. So, for example, if we look at 4-color cellular automaton rules, there are now 64 rather than 27 possible elements (or effectively dimensions) to change, and in this case, many paths of evolution “get further”

and there are more “winners” such as:

How could something like neural nets help us here? Insofar as we can use them to predict cellular automaton evolution, they might give us a way to speed up what amounts to the computation of the loss for each candidate rule—though from what we saw in an earlier section, computational irreducibility is likely to limit this. Another possibility is that—much as in the previous section—we could try to use neural nets to guide us in which random changes to make at each generation. But while computational irreducibility probably helps in making things “effectively random enough” that we won’t get stuck, it makes it difficult to have something like a neural net successfully tell us “which way to go”.

Science as Narrative

In many ways one can view the essence of science—at least as it’s traditionally been practiced—as being about taking what’s out there in the world and somehow casting it in a form we humans can think about. In effect, we want science to provide a human-accessible narrative for what happens, say in the natural world.

The phenomenon of computational irreducibility now shows us that this will often ultimately not be possible. But whenever there’s a pocket of computational reducibility it means that there’s some kind of reduced description of at least some part of what’s going on. But is that reduced description something that a human could reasonably be expected to understand? Can it, for example, be stated succinctly in words, formulas, or computational language? If it can, then we can think of it as representing a successful “human-level scientific explanation”.

So can AI help us automatically create such explanations? To do so it must in a sense have a model for what we humans understand—and how we express this understanding in words, etc. It doesn’t do much good to say “here are 100 computational steps that produce this result”. To get a “human-level explanation” we need to break this down into pieces that humans can assimilate.

As an example, consider a mathematical proof, generated by automated theorem proving:

Automated theorem–proving table

A computer can readily check that this is correct, in that each step follows from what comes before. But what we have here is a very “non-human thing”—about which there’s no realistic “human narrative”. So what would it take to make such a narrative? Essentially we’d need “waypoints” that are somehow familiar—perhaps famous theorems that we readily recognize. Of course there may be no such things. Because what we may have is a proof that goes through “uncharted metamathematical territory”. So—AI assisted or not—human mathematics as it exists today may just not have the raw material to let us create a human-level narrative.

In practice, when there’s a fairly “short metamathematical distance” between steps in a proof, it’s realistic to think that a human-level explanation can be given. And what’s needed is very much like what Wolfram|Alpha does when it produces step-by-step explanations of its answers. Can AI help? Potentially, using methods like our second approach to AI-assisted multicomputation above.

And, by the way, our efforts with Wolfram Language help too. Because the whole idea of our computational language is to capture “common lumps of computational work” as built-in constructs—and in a sense the process of designing the language is precisely about identifying “human-assimilable waypoints” for computations. Computational irreducibility tells us that we’ll never be able to find such waypoints for all computations. But our goal is to find waypoints that capture current paradigms and current practice, as well as to define directions and frameworks for extending these—though ultimately “what we humans know about” is something that’s determined by the state of human knowledge as it’s historically evolved.

Proofs and computational language programs are two examples of structured “scientific narratives”. A potentially simpler example—aligned with the mathematical tradition for science—is a pure formula. “It’s a power law”. “It’s a sum of exponentials”. Etc. Can AI help with this? A function like FindFormula is already using machine-learning-inspired techniques to take data and try to produce a “reasonable formula for it”.

Here’s what it does for the first 100 primes:

Going to 10,000 primes it produces a more complicated result:

Or, let’s say we ask about the relation between GDP and population for countries. Then we can get formulas like:

But what (if anything) do these formulas mean? It’s a bit like with proof steps and so on. Unless we can connect what’s in the formulas with things we know about (whether in number theory or economics) it’ll usually be difficult to conclude much from them. Except perhaps in some rare cases where one can say “yes, that’s a new, useful law”—like in this “derivation” of Kepler’s third law (where 0.7 is a pretty good approximation to 2/3):

There’s an even more minimal example of this kind of thing in recognizing numbers. Type a number into Wolfram|Alpha and it’ll try to tell you what “possible closed forms” for the number might be:

Possible closed forms of 12.1234

There are all sorts of tradeoffs here, some very AI informed. What’s the relative importance of getting more digits right compared to having a simple formula? What about having simple numbers in the formula compared to having “more obscure” mathematical constants (e.g. π versus Champernowne’s number)? When we set up this system for Wolfram|Alpha 15 years ago, we used the negative log frequency of constants in the mathematical literature as a proxy for their “information content”. With modern LLM techniques it may be possible to do a more holistic job of finding what amounts to a “good scientific narrative” for a number.

But let’s return to things like predicting the outcome of processes such as cellular automaton evolution. In an earlier section we discussed getting neural nets to do this prediction. We viewed this essentially as a “black-box” approach: we wanted to see if we could get a neural net to successfully make predictions, but we weren’t asking to get a “human-level understanding” of those predictions.

It’s a ubiquitous story in machine learning. One trains a neural net to successfully predict, classify, or whatever. But if one “looks inside” it’s very hard to tell what’s going on. Here’s the final result of applying an image identification neural network:

And here are the “intermediate thoughts” generated after going through about half the layers in the network:

Maybe something here is a “definitive signature of catness”. But it’s not part of our current scientific lexicon—so we can’t usefully use it to develop a “scientific narrative” that explains how the image should be interpreted.

But what if we could reduce our images to just a few parameters—say using an autoencoder of the kind we discussed above? Conceivably we could set things up so that we’d end up with “interpretable parameters”—or, in other words, parameters where we can give a narrative explanation of what they mean. For example, we could imagine using something like an LLM to pick parameters that somehow align with words or phrases (“pointiness”, “fractal dimension”, etc.) that appear in explanatory text from around the web. And, yes, these words or phrases could be based on analogies (“cactus-shaped”, “cirrus-cloud-like”, etc.)—and something like an LLM could “creatively” come up with these names.

But in the end there’s nothing to say that a pocket of computational reducibility picked out by a certain autoencoder will have any way to be aligned with concepts (scientific or otherwise) that we humans have yet explored, or so far given words to. Indeed, in the ruliad at large, it is overwhelmingly likely that we’ll find ourselves in “interconcept space”—unable to create what we would consider a useful scientific narrative.

This depends a bit, however, on just how we constrain what we’re looking at. We might implicitly define science to be the study of phenomena for which we have—at some time—successfully developed a scientific narrative. And in this case it’s of course inevitable that such a narrative will exist. But even given a fixed method of observation or measurement it’s basically inevitable that as we explore, computational irreducibility will lead to “surprises” that break out of whatever scientific narrative we were using. Or in other words, if we’re really going to discover new science, then—AI or not—we can’t expect to have a scientific narrative based on preexisting concepts. And perhaps the best we can hope for is that we’ll be able to find pockets of reducibility, and that AI will “understand” enough about us and our intellectual history that it’ll be able to suggest a manageable path of new concepts that we should learn to develop a successful scientific narrative for what we discover.

Finding What’s Interesting

A central part of doing open-ended science is figuring out “what’s interesting”. Let’s say one just enumerates a collection of cellular automata:

The ones that just die out—or make uniform patterns—“don’t seem interesting”. The first time one sees a nested pattern generated by a cellular automaton, it might seem interesting (as it did to me in 1981). But pretty soon it comes to seem routine. And at least as a matter of basic ruliology, what one ends up looking for is “surprise”: qualitatively new behavior one hasn’t seen before. (If one’s concerned with specific applications, say to modeling particular systems in the world, then one might instead want to look at rules with certain structure, whether or not their behavior “abstractly seems interesting”.)

The fact that one can expect “surprises” (and indeed, be able to do useful, truly open-ended science at all) is a consequence of computational irreducibility. And whenever there’s a “lack of surprise” it’s basically a sign of computational reducibility. And this makes it plausible that AI—and neural nets—could learn to identify at least certain kinds of “anomalies” or “surprises”, and thereby discover some version of “what’s interesting”.

Usually the basic idea is to have a neural net learn the “typical distribution” of data—and then to identify outliers relative to this. So for example we might look at a large number of cellular automaton patterns to learn their “typical distribution”, then plot a projection of this onto a 2D feature space, indicating where certain specific patterns lie:

Some of the patterns show up in parts of the distribution where their probabilities are high, but others show up where the probabilities are low—and these are the outliers:

Are these outliers “interesting”? Well, it depends on your definition of “interesting”. And in the end that’s “in the eye of the beholder”. Here, the “beholder” is a neural net. And, yes, these particular patterns wouldn’t be what I would have picked. But relative to the “typical patterns” they do seem at least “somewhat different”. And presumably it’s basically a story like the one with neural nets that distinguish pictures of cats and dogs: neural nets make at least somewhat similar judgements to the ones we do—perhaps because our brains are structurally like neural nets.

OK, but what does a neural net “intrinsically find interesting”? If the neural net is trained then it’ll very much be influenced by what we can think of as the “cultural background” it gets from this training. But what if we just set up neural nets with a given architecture, and pick their weights at random? Let’s say they’re neural nets that compute functions . Then here are examples of collections of functions they compute:

Not too surprisingly, the functions that come out very much reflect the underlying activation functions that appear at the nodes of our neural nets. But we can see that—a bit like in a random walk process—“more extreme” functions are less likely to be produced by neural nets with random weights, so can be thought of as “intrinsically more surprising” for neural nets.

But, OK, “surprise” is one potential criterion for “interestingness”. But there are others. And to get a sense of this we can look at various kinds of constructs that can be enumerated, and where we can ask which possible ones we consider “interesting enough” that we’ve, for example, studied them, given them specific names, or recorded them in registries.

As a first example, let’s consider a family of hydrocarbon molecules: alkanes. Any such molecule can be represented by a tree graph with nodes corresponding to carbon atoms, and having valence at most 4. There are a total of 75 alkanes with 10 or fewer carbons, and all of them typically appear in standard lists of chemicals (and in our Wolfram Knowledgebase). But with 10 carbons only some alkanes are “interesting enough” that they’re listed, for example in our knowledgebase (aggregating different registries one finds more alkanes listed, but by 11 carbons at least 42 out of 159 always seem to be “missing”—and are not highlighted here):

What makes some of these alkanes be considered “more interesting” in this sense than others? Operationally it’s a question of whether they’ve been studied, say in the academic literature. But what determines this? Partly it’s a matter of whether they “occur in nature”. Sometimes—say in petroleum or coal—alkanes form through what amount to “random reactions”, where unbranched molecules tend to be favored. But alkanes can also be produced in biological systems, through careful orchestration, say by enzymes. But wherever they come from, it’s as if the alkanes that are more familiar are the ones that seem “more interesting”. So what about “surprise”? Whether a “surprise alkane”—say made by explicit synthesis in a lab—is considered “interesting” probably depends first and foremost on whether it’s identified to have “interesting properties”. And that in turn tends to be a question of how its properties fit into the whole web of human knowledge and technology.

So can AI help in determining which alkanes we’re likely to consider interesting? Traditional computational chemistry—perhaps sped up by AI—can potentially determine the rates at which different alkanes are “randomly produced”. And in a quite different direction, analyzing the academic literature—say with an LLM—can potentially predict how much a certain alkane can be expected to be studied or talked about. Or (and this is particularly relevant for drug candidates) whether there are existing hints of “if only we could find a molecule that does ___” that one can pick up from things like academic literature.

As another example, let’s consider mathematical theorems. Much like with chemicals, one can in principle enumerate possible mathematical theorems by starting from axioms and then seeing what theorems can progressively be derived from them. Here’s what happens in just two steps starting from some typical axioms for logic:

There are a vast number of “uninteresting” (and often seemingly very pedantic) theorems here. But among all these there are two that are interesting enough that they’re typically given names (“the idempotence laws”) in textbooks of logic. Is there any way to determine whether a theorem will be given a name? One might have thought that would be a purely historical question. But at least in the case of logic there seems to be a systematic pattern. Let’s say one enumerates theorems of logic starting with the simplest, and going on in a lexicographic order. Most theorems in the list will be derivable from earlier ones. But a few will not. And these turn out to be basically exactly the ones that are typically given names (and highlighted here):

Or, in other words, at least in the rather constrained case of basic logic, the theorems considered interesting enough to be given names are the ones that “surprise us with new information”.

If we look more generally in “metamathematical space” we can get some empirical idea of where theorems that have been “considered interesting” lie:

Could an AI predict this? We could certainly create a neural net trained from the existing literature of mathematics, and its few million stated theorems. And we could then start feeding this neural net theorems found by systematic enumeration, and asking it to determine how plausible they are as things that might appear in mathematical literature. And in our systematic enumeration we could even ask the neural net to determine what “directions” are likely to be “interesting”—like in our second method for “AI-assisted traversal of multiway systems” above.

But when it comes to finding “genuinely new science” (or math) there’s a problem with this—because a neural net trained from existing literature is basically going to be looking for “more of the same”. Much like the typical operation of peer review, what it’ll “accept” is what’s “mainstream” and “not too surprising”. So what about the surprises that computational irreducibility inevitably implies will be there? By definition, they won’t be “easily reducible” to what’s been seen before.

Yes, they can provide new facts. And they may even have important applications. But there often won’t be—at least at first—a “human-accessible narrative” that “reaches” them. And what it’ll take to create that is for us humans to internalize some new concept that eventually becomes familiar. (And, yes, as we discussed above, if some particular new concept—or, say, new theorem—seems to be a “nexus” for reaching things, that becomes a target for a concept that’s worth us “adding”.)

But in the end, there’s a certain arbitrariness in which “new facts” or “new directions” we want to internalize. Yes, if we go in a particular direction it may lead us to certain ideas or technology or activities. But abstractly we don’t know which direction we might go is “right”; at least in the first instance, that seems like a quintessential matter of human choice. There’s a potential wrinkle, though. What if our AIs know enough about human psychology and society that they can predict “what we’d like”? At first it might seem that they could then successfully “pick directions”. But once again computational irreducibility blocks us—because ultimately we can’t “know what we’ll like” until we “get there”.

We can relate all this to generative AI, for example for images or text. At the outset, we might imagine enumerating images that consist of arbitrary arrays of pixels. But an absolutely overwhelming fraction of these won’t be at all “interesting” to us; they’ll just look to us like “random noise”:

By training a neural net on billions of human-selected images, we can get it to produce images that are somehow “generally like what we find interesting”. Sometimes the images produced will be recognizable to the point where we’ll be able to give a “narrative explanation” of “what they look like”:

But very often we’ll find ourselves with images “out in interconcept space”:

Are these “interesting”? It’s hard to say. Scanning the brain of a person looking at them, we might notice some particular signal—and perhaps an AI could learn to predict that. But inevitably that signal would change if some type of “interconcept image” become popular, and started, say, to be recognized as a kind of art that people are familiar with.

And in the end we’re back to the same point: things are ultimately “interesting” if our choices as a civilization make them so. There’s no abstract notion of “interestingness” that an AI or anything can “go out and discover” ahead of our choices.

And so it is with science. There’s no abstract way to know “what’s interesting” out of all the possibilities in the ruliad; that’s ultimately determined by the choices we make in “colonizing” the ruliad.

But what if—instead of going out into the “wilds of the ruliad”—we stay close to what’s already been done in science, and what’s already “deemed interesting”? Can AI help us extend what’s there? As a practical matter—at least when supplemented with our computational language as a tool—the answer is at some level surely yes. And for example LLMs should be able to produce things that follow the pattern of academic papers—with dashes of “originality” coming from whatever randomness is used in the LLM.

How far can such an approach get? The existing academic literature is certainly full of holes. Phenomenon A was investigated in system X, and B in Y, but not vice versa, etc. And we can expect that AIs—and LLMs in particular—can be useful in identifying these holes, and in effect “planning” what science is (by this criterion) interesting to do. And beyond this, we can expect that things like LLMs will be helpful in mapping out “usual and customary” paths by which the science should be done. (“When you’re analyzing data like this, one typically quotes such-and-such a metric”; “when you’re doing an experiment like this, you typically prepare a sample like this”; etc.) When it comes to actually “doing the science”, though, our actual computational language tools—together with things like computationally controlled experimental equipment—will presumably be what’s usually more central.

But let’s say we’ve defined some major objective for science (“figure out how to reverse aging”, or, a bit more modestly, “solve cryonics”). In giving such an objective, we’re specifying something we consider “interesting”. And then the problem of getting to that objective is—at least conceptually—like finding a proof of theorem or a synthesis pathway for a chemical. There are certain “moves we can make”, and we need to find out how to “string these together” to get to the objective we want. Inevitably, though, there’s an issue with (multi)computational irreducibility: there may be an irreducible number of steps we need to take to get to the result. And even though we may consider the final objective “interesting”, there’s no guarantee that we’ll find the intermediate steps even slightly interesting. Indeed, in many proofs—as well as in many engineering systems—one may need to build on an immense number of excruciating details to get to the final “interesting result”.

But let’s talk more about the question of what to study—or, in effect, what’s “interesting to study”. “Normal science” tends to be concerned with making incremental progress, remaining within existing paradigms, but gradually filling in and extending what’s there. Usually the most fertile areas are on the interfaces between existing well-developed areas. At the outset, it’s not at all obvious that different areas of science should ultimately fit together at all. But given the concept of the ruliad as the ultimate underlying structure, this begins to seem less surprising. Still, to actually see how different areas of science can be “knitted together” one will often have to identify—perhaps initially quite surprising—analogies between very different descriptive frameworks. “A decidable theory in metamathematics is like a black hole in physics”; “concepts in language are like particles in rulial space”; etc.

And this is an area where one can expect LLMs to be helpful. Having seen the “linguistic pattern” of one area, one can expect them to be able to see its correspondence in another area—potentially with important consequences.

But what about fresh new directions in science? Historically, these have often been the result of applying some new practical methodology (say for doing a new kind of experiment or measurement)—that happens to open up some “new place to look”, where people have never looked before. But usually one of the big challenges is to recognize that something one sees is actually “interesting”. And to do this often in effect involves the creation of some new conceptual framework or paradigm.

So can AI—as we’ve been discussing it here—be expected to do this? It doesn’t seem likely. AI is typically something trained on existing human material, intended to extrapolate directly from that. It’s not something built to “go out into the wilds of the ruliad”, far from anything already connected to humans.

But in a sense that is the domain of “arbitrary computation”, and of things like the simple programs we might enumerate or pick at random in ruliology. And, yes, by going out into the “wilds of the ruliad” it’s easy enough to find fresh, new things not currently assimilated into science. The challenge, though, is to connect them to anything we humans currently “understand” or “find interesting”. And that, as we’ve said before, is something that quintessentially involves human choice, and the foibles of human history. There are an infinite collection of paths that could be taken. (And indeed, in a “society of AIs”, there could be AIs that pursue a certain collection of them.) But in the end what matters to us humans and the enterprise we normally call “science” is our internal experience. And that’s something we ultimately have to form for ourselves.

Beyond the “Exact Sciences”

In areas like the physical sciences we’re used to the idea of being able to develop broad theories that can do things like make quantitative predictions. But there are many areas—for example in the biological, human and social sciences—that have tended to operate in much less formal ways, and where things like long chains of successful theoretical inferences are largely unheard of.

So might AI change that? There seem to be some interesting possibilities, particularly around the new kinds of “measurements” that AI enables. “How similar are those artworks?” “How close are the morphologies of those organisms?” “How different are those myths?” These are questions that in the past one mostly had to address by writing an essay. But now AI potentially gives us a path to make such things more definite—and in some sense quantitative.

Typically the key idea is to figure out how to take “unstructured raw data” and extract “meaningful features” from it that can be handled in formal, structured ways. And the main thing that makes this possible is that we have AIs that have been trained on large corpora that reflect “what’s typical in our world”—and which have in effect formed definite internal representations of the world, in terms of which things can for example be described (as we did above) by lists of numbers.

What do those numbers mean? At the outset we typically have no idea; they’re just the output of some neural net encoder. But what’s important is that they’re definite, and repeatable. Given the same input data, one will always get the same numbers. And, what’s more, it’s typical that when data “seems similar” to us, it’ll tend to be assigned nearby numbers.

In an area like physical science, we expect to build specific measuring devices that measure quantities we “know how to interpret”. But AI is much more of a black box: something is being measured, but at least at the outset we don’t necessarily have any interpretation of it. Sometimes we’ll be able to do training that associates some description we know, so that we’ll get at least a rough interpretation (as in a case like sentiment analysis). But often we won’t.

(And it has to be said that something similar can happen even in physical science. Let’s say we test whether one material scratches the surface of another. Presumably we can interpret that as some kind of hardness of the material, but really it’s just a measurement, that becomes significant if we can successfully associate it with other things.)

One thing that’s particularly notable about “AI measurements” is how they can potentially pick out “small signals” from large volumes of unstructured data. We’re used to having methods like statistics to do similar things on structured, numerical data. But it’s a different story to ask from billions of webpages whether, say, kids who like science typically prefer cats or dogs.

But given an “AI measurement” what can we expect to do with it? None of this is very clear yet, but it seems at least possible that we can start to find formal relationships. Perhaps it will be a quantitative relationship involving numbers; perhaps it will be better represented by a program that describes a computational process by which one measurement leads to others.

It’s been common for some time in areas like quantitative finance to find relationships between what amount to simple forms of “AI measurements”—and to be concerned mainly with whether they work, rather than why they work, or how one might narratively describe them.

In a sense it seems rather unsatisfactory to try to build science on “black-box” AI measurements that one can’t interpret. But at some level this is just an accelerated version of what we often do, say with everyday language. We’re exposed to some new observation or measurement. And eventually we invent words to describe it (“it looks like a fractal”, etc.). And then we can start “reasoning in terms of it”, etc.

But AI measurements are potentially a much richer source of formalizable material. But how should we do that formalization? Computational language seems to be key. And indeed we already have examples in the Wolfram Language—where functions like ImageIdentity or TextCases (or, for that matter, LLMFunction) can effectively make “AI measurements”, but then we can take their results, and work symbolically with them.

In physical science we often imagine that we’re working only with “objective measurements” (though my recent “observer theory” implies that actually our nature as observers is crucial even). But AI measurements seem to have a certain immediate “subjectivity”—and indeed their details (say, associated with the particulars of a neural net encoder) will be different for every different AI we use. But what’s important is that if the AI is trained on very large amounts of human experience, there’ll be a certain robustness to it. In a sense we can view many AI measurements as being like the output of a “societal observer”—that uses something like the whole mass of human experience, and in doing so gains a certain “centrality” and “inertia”.

What kind of science can we expect to build on the basis of what a “societal observer” measures? For the most part, we don’t yet know. There’s some reason to think that (as in the case of physics and metamathematics) such measurements might tap into pockets of computational reducibility. And if that’s the case, we can expect that we’ll be able to start doing things like making predictions—albeit perhaps only for the results of “AI measurements” which we’ll find hard to interpret. But by connecting such AI measurements to computational language, there seems to be the potential to start constructing “formalized science” in places where it’s never been possible before—and in doing so, to extend the domain of what we might call “exact sciences”.

(By the way, another promising application of modern AIs is in setting up “repeatable personas”: entities that effectively behave like humans with certain characteristics, but on which large-scale repeatable experiments of the kind typical in physical science can be done.)

So… Can AI Solve Science?

At the outset, one might be surprised that science is even possible. Why is it that there is regularity that we can identify in the world that allows us to form “scientific narratives”? Indeed, we now know from things like the concept of the ruliad that computational irreducibility is inevitably ubiquitous—and with it fundamental irregularity and unpredictability. But it turns out that the very presence of computational irreducibility necessarily implies that there must be pockets of computational reducibility, where at least certain things are regular and predictable. And it is within these pockets of reducibility that science fundamentally lives—and indeed that we try to operate and engage with the world.

So how does this relate to AI? Well, the whole story of things like trained neural nets that we’ve discussed here is a story of leveraging computational reducibility, and in particular computational reducibility that’s somehow aligned with what human minds also use. In the past the main way to capture—and capitalize on—computational reducibility was to develop formal ways to describe things, typically using mathematics and mathematical formulas. AI in effect provides a new way to make use of computational reducibility. Normally there’s no human-level narrative to how it works; it’s just that somehow within a trained neural net we manage to capture certain regularities that allow us, for example, to make certain predictions.

In a sense the predictions tend to be very “human style”, often looking “roughly right” to us, even though at the level of precise formal detail they’re not quite right. And fundamentally they rely on computational reducibility—and when computational irreducibility is present they more or less inevitably fail. In a sense, the AI is doing “shallow computation”, but when there’s computational irreducibility one needs irreducible, deep computation to work out what will happen.

And there are plenty of places—even in working with traditional mathematical structures—where what AI does won’t be sufficient for what we expect to get out of science. But there are also places where “AI-style science” can make progress even when traditional methods cannot. If one’s doing something like solving a single equation (say, ODE) precisely, AI probably won’t be the best tool. But if one’s got a big collection of equations (say for something like robotics) AI may successfully be able to give a useful “rough estimate” of what will happen, even when traditional methods would get utterly bogged down in details.

It’s a general feature of machine learning—and AI—techniques that they can be very useful if an approximate (“80%”) answer is good enough. But they tend to fail when one needs something more “precise” and “perfect”. And there are quite a few workflows in science (and probably more that can be identified) where this is exactly what one needs. “Pick out candidate cases for something”. “Identify a feature that might important”. “Suggest a possible question to explore”.

There are clear limitations, though, particularly whenever there’s computational irreducibility. In a sense the typical AI approach to science doesn’t involve explicitly “formalizing things”. But in many areas of science formalization is precisely what’s been most valuable, and what’s allowed towers of results to be obtained. And in recent times we have the powerful new idea of formalizing things computationally—and in particular in using computational language to do this.

And given such a computational formalization, we’re able to start doing irreducible computations that let us reach discoveries we have no way to anticipate. We can, for example, enumerate possible computational systems or processes, and see “fundamental surprises”. In typical AI there’s randomness that gives us a certain degree of “originality” in our exploration. But it’s of a fundamentally lower level than we can reach with actual irreducible computations.

So what should we expect for AI in science going forward? We’ve got in a sense a new—and rather human-like—way of leveraging computational reducibility. It’s a new tool for doing science, destined to have many practical uses. In terms of fundamental potential for discovery, though, it pales in comparison to what we can build from the computational paradigm, and from irreducible computations that we do. But probably what will give us the greatest opportunity to move science forward is to combine the strengths of AI and of the formal computational paradigm. Which, yes, is part of what we’ve been vigorously pursuing in recent years with the Wolfram Language and its connections to machine learning and now LLMs.

Notes

My goal here has been to outline my current thinking about the fundamental potential (and limitations) of AI in science—developing my ideas by using the Wolfram Language and its AI capabilities to do various simple experiments. I view what I’ve done here as just a beginning. Essentially every experiment could, for example, be done in much more detail, and with much more analysis. (And just click any image to get the Wolfram Language that made it, so you can repeat or extend it.)

“AI in science” is a hot topic these days in the world at large, and I am surely aware only of a small part of everything that’s been done. My own emphasis has been on trying to “do the obvious experiments” and trying to piece together for myself the “big picture” of what’s going on. I should emphasize that there’ve been a regular stream of outstanding and impressive “engineering innovations” in AI in recent times, and I won’t be at all surprised if experiments that haven’t worked well for me could be dramatically improved by future such innovations, conceivably even changing my “big-picture” conclusions from them.

I must also offer an apology. While I’ve been exposed—though often basically just “through the grapevine”—to lots of things being done on “AI in science”, especially over the past year, I haven’t made any serious attempt to systematically study the literature of the field, or trace its history and the provenance of ideas in it. So I must leave it to others to make connections between what I’ve done here and what other people may (or may not) have done elsewhere. It’d be fascinating to do a serious analysis of the history of work on AI in science, but it’s not something I’ve had a chance to do.

In my efforts here I have been greatly assisted by Wolfram Institute fellows Richard Assar (“Ruliad Fellow”) and Nik Murzin (“Fourmilab Fellow”). I’m also grateful to the many people who I’ve talked to—or heard from—about AI in science (and related topics) in recent times, including Giulio Alessandrini, Mohammed AlQuraishi, Brian Frezza, Roger Germundsson, George Morgan, Michael Trott and Christopher Wolfram.

🔲 ☆

Games and Puzzles as Multicomputational Systems

Games and Puzzles as Multicomputational Systems

Humanizing Multicomputational Processes

Multicomputation is one of the core ideas of the Wolfram Physics Project—and in particular is at the heart of our emerging understanding of quantum mechanics. But how can one get an intuition for what is initially the rather abstract idea of multicomputation? A good approach, I believe, is to see it in action in familiar systems and situations. And I explore here what seems like a particularly good example: games and puzzles.

One might not imagine that something as everyday as well-known games and puzzles would have any connection to the formalism for something like quantum mechanics. But the idea of multicomputation provides a link. And indeed one can view the very possibility of being able to have “interesting” games and puzzles as being related to a core phenomenon of multicomputation: multicomputational irreducibility.

In an ordinary computational system each state of the system has a unique successor, and ultimately there is a single thread of time that defines a process of computation. But in a multicomputational system the key idea is that states can have multiple successors—and tracing their behavior defines a whole multiway graph of branching and merging threads of time. And the point is that this is directly related to how one can think about typical games and puzzles.

Given a particular state of a game or puzzle, a player must typically decide what to do next. And where the idea of multicomputation comes in is that there are usually several choices that they can make. In any particular instance of the game, they’ll make a particular choice. But the point of the multicomputational paradigm is to look globally at the consequences of all possible choices—and to produce a multiway graph that represents them.

The notion of making what we call a multiway graph has actually existed—usually under the name of “game graphs”—for games and puzzles for a bit more than a hundred years. But with the multicomputational paradigm there are now some more general concepts that can be applied to these constructs. And in turn understanding the relation to games and puzzles has the potential to provide a new level of intuition and familiarity about multiway graphs.

My particular goal here is to investigate—fairly systematically—a sequence of well-known games and puzzles using the general methods we’ve been developing for studying multicomputational systems. As is typical in investigations that connect with everyday things, we’ll encounter all sorts of specific details. And while these may not immediately seem relevant to larger-scale discussions, they are important in our effort to provide a realistic and relatable picture of actual games and puzzles—and in allowing the connections we make with multicomputation to be on a solid foundation.

It’s worth mentioning that the possibility of relating games and puzzles to physics is basically something that wouldn’t make sense without our Physics Project. For games and puzzles are normally at some fundamental level discrete—especially in the way that they involve discrete branching of possibilities. And if one assumes physics is fundamentally continuous, there’s no reason to expect a connection. But a key idea of our Physics Project is that the physical world is at the lowest level discrete—like games and puzzles. And what’s more, our Physics Project posits that physics—like games and puzzles—has discrete possibilities to explore.

At the outset each of the games and puzzles I discuss here may seem rather different in their structure and operation. But what we’ll see is that when viewed in a multicomputational way, there is remarkable—and almost monotonous—uniformity across our different examples. I won’t comment too much on the significance of what we see until the end, when I’ll begin to discuss how various important multicomputational phenomena may play out in the context of games and puzzles. And how the very difficulty of conceptualizing multicomputation in straightforward human terms is what fundamentally leads to the engaging character of games and puzzles.

Tic-Tac-Toe

Consider a simplified version of tic-tac-toe (AKA “noughts and crosses”) played on a 2×2 board. Assume X plays first. Then one can represent the possible moves by the graph:

&#10005

On the next turn one gets:

&#10005

So far this graph is a simple tree. But if we play another turn we’ll see that different branches can merge, and “playing until the board is full” we get a multiway graph—or “game graph”—of the form:

&#10005

Every path through this graph represents a possible complete game:

&#10005

In our setup so far, the total number of board configurations that can ever be reached in any game (i.e. the total number of nodes in the graph) is 35, while the total number of possible complete games (i.e. the number of possible paths from the root of the graph) is 24.

If one renders the graph in 3D one can see that it has a very regular structure:

&#10005

And now if we define “winning” 2×2 tic-tac-toe as having two identical elements in a horizontal row, then we can annotate the multiway graph to indicate wins—removing cases where the “game is already over”:

&#10005

Much of the core structure of the multiway graph is actually already evident even in the seemingly trivial case of “one-player tic-tac-toe”, in which one is simply progressively filling in squares on the board:

&#10005

But what makes this not completely trivial is the existence of distinct paths that lead to equivalent states. Rendered differently the graph (which has 24 = 16 nodes and 4! = 24 “game paths”) has an obvious 4D hypercube form (where now we have dropped the explicit X’s in each cell):

&#10005

For a 3×3 board the graph is a 9D hypercube with 29 = 512 nodes and 9! = 362880 “game paths”, or in “move-layered” form:

&#10005

This basic structure is already visible in “1-player 1D tic-tac-toe” in which the multiway graph for a “length-n” board just corresponds to an n-dimensional hypercube:

&#10005

The total number of distinct board configurations in this case is just 2n, and the number of distinct “games” is n!. At move t the number of distinct board configurations (i.e. states) is Binomial[n, t].

With 2 players the graphs become slightly more complicated:

&#10005

The total number of states in these graphs is

&#10005

which is asymptotically . (Note that for n = 4 the result is the same as for the 2×2 board discussed above.) At move t the number of distinct states is given by

&#10005

&#10005

OK, so what about standard 2-player 3×3 tic-tac-toe? Its multiway graph begins:

&#10005

After 2 steps (i.e. one move by X and one by O) the graph is still a tree (with the initial state now at the center):

&#10005

After 3 steps there is starting to be merging:

&#10005

And continuing for all 9 moves the full layered graph—with 6046 states—is:

&#10005

At the level of this graph, the results are exactly the same as for a 2-player 1D version with a total of 9 squares. But for actual 2D 3×3 tic-tac-toe there is an additional element to the story: the concept of winning a game, and thereby terminating it. With the usual rules, a game is considered won when a player gets a horizontal, vertical or diagonal line of three squares, as in for example:

&#10005

Whenever a “win state” such as these is reached, the game is considered over, so that subsequent states in the multiway graph are pruned, and what was previously a 6046-node graph becomes a 5478-node graph

&#10005

with examples of the 568 pruned states including (where the “win” that terminated the game is marked):

&#10005

Wins can occur at different steps: anywhere from 5 to 9. The total numbers of distinct wins are as follows

&#10005

(yielding 626 wins at any step for X and 316 for O).

One can’t explicitly tell that a game has ended in a draw until every square has been filled in—and there are ultimately only 16 final “draw configurations” that can be reached:

&#10005

We can annotate the full (“game-over-pruned”) multiway graph, indicating win and draw states:

&#10005

To study this further, let’s start by looking at a subgraph that includes only “end games” starting with a board that already has 4 squares filled in:

&#10005

We see here that from our initial board

&#10005

it’s possible to get a final win for both X and O:

&#10005

But in many of these cases the outcome is already basically determined a step or more before the actual win occurs—in the sense that unless a given player “makes a mistake” they will always be able to force a win.

So, for example, if it is X’s turn and the state is

&#10005

then X is guaranteed to win if they play as follows:

&#10005

We can represent the “pre-forcing” of wins by coloring subgraphs (or in effect “light cones”) in the multiway graph:

&#10005

At the very beginning of the game, when X makes the first move, nothing is yet forced. But after just one move, it’s already possible to get to configurations where X can always force a win:

&#10005

Starting from a state obtained after 1 step, we can see that after 2 steps there are configurations where O can force a win:

&#10005

Going to more moves leads to more “forced-win” configurations:

&#10005

Annotating the whole multiway graph we get:

&#10005

We can think of this graph as a representation of the “solution” to the game: given any state the coloring in the graph tells us which player can force a win from that state, and the graph defines what moves they can make to do so.

Here’s a summary of possible game states at each move:

&#10005

&#10005

Here we’re just counting the number of possible states of various kinds at each step. But is there a way to think about these states as somehow being laid out in “game state space”? Branchial graphs provide a potential way to do this. The basic branchial graph at a particular step is obtained by joining pairs of states that share a common ancestor on the step before. For the case of 2-player 2×2 tic-tac-toe the branchial graphs we get on successive steps are as follows:

&#10005

Things get more complicated for ordinary 3×3 tic-tac-toe. But since the multiway graph for the first two steps is a pure tree, the branchial graphs at these steps still have a rather trivial structure:

&#10005

In general the number of connected components on successive steps is as follows

&#10005

and these are broken down across different graph structures as follows:

&#10005

Here in more detail are the forms of some typical components of branchial graphs achieved at particular steps:

&#10005

Within the branchial graph at a particular step, there can be different numbers of wins in different components:

&#10005

It’s notable that the wins are quite broadly distributed across branchial graphs. And this is in a sense why tic-tac-toe is not (more) trivial. If just by knowing what component of the branchial graph one was in one could immediately know the outcome, there would be even less “suspense” in the game. But with broad distribution across branchial space, “knowing roughly where you are” doesn’t help much in determining whether you’re going to win.

So far we’ve always been talking about what states can be reached, but not “how often” they’re reached. Imagine that rather than playing a specific game, we instead at each step just make every possible move with equal probability. The setup for tic-tac-toe is symmetrical enough that for most of the game the probability of every possible configuration at a given step is equal. But as soon as there start to be “wins”, and there is a “cone” of “game-over-pruned” states, then the remaining states no longer have equal probabilities.

For standard 3×3 tic-tac-toe this happens after 7 moves, where there are two classes of states, that occur with slightly different probabilities:

&#10005

At the end of the game, there are several classes of final states with different probabilities:

&#10005

And what this means for the probabilities of different outcomes of the game is as follows:

&#10005

Not surprisingly, the player who plays first has an advantage in winning. Perhaps more surprising is that in this kind of “strategyless” play, ties are comparatively uncommon—even though if one player actively tries to block the other, they often force a tie.

We’ve looked at “classic tic-tac-toe” and a few specific variants. But there are ultimately all sorts of possible variants. And a convenient general way to represent the “board” for any tic-tac-toe-like game is just to give a “flattened” list of values—with 0 representing a blank position, and i representing a symbol added by player i.

In standard “2D representation” one might have a board like

&#10005

which in flattened form would be:

&#10005

Typical winning patterns can then be represented

&#10005

where in each case we have framed the relevant “winning symbols”, and then given their positions in the flattened list. In ordinary tic-tac-toe it’s clear that the positions of “winning symbols” must always form an arithmetic progression. And it seems as if a good way to generalize tic-tac-toe is always to define a win for i to be associated with the presence of i symbols at positions that form an arithmetic progression of a certain length s. For ordinary tic-tac-toe s = 3, but for generalizations it could have other values.

Consider now the case of a length-5 list (i.e. 5-position “1D board”). The complete multiway graph is as follows, with “winning states” that contain arithmetic progressions of length s = 3 highlighted:

&#10005

In a more symmetrical rendering this is:

&#10005

Here’s the analogous result for a 7-position board, and 2 players:

&#10005

For each size of board n, we can compute the total number of winning states for any given player, as well as the total number of states altogether. The result when winning is based on arithmetic progressions of length 3 (i.e. s = 3) is:

&#10005

The 2-player n = 9 (= 3×3) case here is similar to ordinary tic-tac-toe, but not the same. In particular, states like

&#10005

are considered wins for X in the flattened setup, but not in ordinary tic-tac-toe.

If we increase the length of progression needed in order to declare a win, say to s = 4, we get:

&#10005

The total number of game states is unchanged, but—as expected—there are “fewer ways to win”.

But let’s say we have boards that are completely filled in. For small board sizes there may well not be an arithmetic progression of positions for any player—so that the game has to be considered a tie—as we see in this n = 5 case:

&#10005

But it is a result related to Ramsey theory that it turns out that for n ≥ 9, it’s inevitable that there will be an “arithmetic progression win” for at least one of the players—so that there is never a tie—as these examples illustrate:

&#10005


Walks and Their Multiway Graphs

A game like tic-tac-toe effectively involves at each step moving to one of several possible new board configurations—which we can think of as being at different “places” in “game state space”. But what if instead of board configurations we just consider our states to be positions on a lattice such as

&#10005

and then we look at possible walks, that at each step can, in this case, go one unit in any of 4 directions?

Starting at a particular point, the multiway graph after 1 step is just

&#10005

where we have laid out this graph so that the “states” are placed at their geometrical positions on the lattice.

After 2 steps we get:

&#10005

And in general the structure of the multiway graph just “recapitulates” the structure of the lattice:

&#10005

We can think of the paths in the multiway graph as representing all possible random walks of a certain length in the lattice. We can lay the graph out in 3D, with the vertical position representing the first step at which a given point can be reached:

&#10005

We can also lay out the graph more like we laid out multiway graphs for tic-tac-toe:

&#10005

One feature of these “random-walk” multiway graphs is that they contain loops, that record the possibility of “returning to places one’s already been”. And this is different from what happens for example in tic-tac-toe, in which at each step one is just adding an element to the board, and it’s never possible to go back.

But we can set up a similar “never-go-back rule” for walks, by considering “self-avoiding walks” in which any point that’s been visited can never be visited again. Let’s consider first the very trivial lattice:

&#10005

Now indicate the “current place we’ve reached” by a red dot, and the places we’ve visited before by blue dots—and start from one corner:

&#10005

There are only two possible walks here, one going clockwise, the other counterclockwise. Allowing one to start in each possible position yields a slightly more complicated multiway graph:

&#10005

With a 2×3 grid we get

&#10005

while with a 3×3 grid we get:

&#10005

Starting in the center, and with a different layout for the multiway graph, we get:

&#10005

Note the presence of large “holes”, in which paths on each side basically “get to the same place” in “opposite ways”. Note that of the 2304 possible ways to have 1 red dot and up to 8 blue ones, this actual multiway graph reaches only 57. (Starting from the corner reaches 75 and from all possible initial positions 438.)

With a 4×4 lattice (starting the walker in the corner) the multiway graph has the form

&#10005

or in an alternative layout

&#10005

where now 1677 states out of 524,288 are eventually visited, and the number of new states visited at each step (i.e. the number of nodes in successive layers in the graph) is:

&#10005

For a 5×5 grid 89,961 states are reached, distributed across steps according to:

&#10005

(For a grid with n vertices, there are a total of n 2n–1 possible states, but the number actually reached is always much smaller.)

In talking about walks, an obvious question to ask is about mazes. Consider the maze:

&#10005

As far as traversing this maze is concerned, it is equivalent to “walking” on the graph

&#10005

which in another embedding is just

&#10005

But just as before, the multiway graph that represents all possible walks essentially just “recapitulates” this graph. And that means that “solving” the maze can in a sense equally be thought of as finding a path directly in the maze graph, or in the multiway graph:

&#10005


The Icosian Game & Some Relatives

Our discussion of self-avoiding walks turns out to be immediately related to the “Icosian game” of William Rowan Hamilton from 1857 (which is somewhat related to the early computer game Hunt the Wumpus):

The Icosian game

The object of the “game” (or, more properly, puzzle) is to find a path (yes, a Hamiltonian path) around the icosahedron graph that visits every node (and returns back to where it started from). And once again we can construct a multiway graph that represents all possible sequences of “moves” in the game.

Let’s start with the simpler case of an underlying tetrahedron graph:

&#10005

From this we get the multiway graph:

&#10005

The “combined multiway graph” from all possible starting positions on the tetrahedron graph gives a truncated cuboctahedron multiway graph:

&#10005

And following this graph we see that from any initial state it’s always possible to reach a state where every node in the tetrahedron graph has been visited. In fact, because the tetrahedron graph is a complete graph it’s even guaranteed that the last node in the sequence will be “adjacent” to the starting node—so that one has formed a Hamiltonian cycle and solved the puzzle.

Things are less trivial for the cube graph:

&#10005

The multiway graph (starting from a particular state) in this case is:

&#10005

Now there are 13 configurations where no further moves are possible:

&#10005

In some of these, one’s effectively “boxed in” with no adjacent node to visit. In others, all the nodes have been filled in. But only 3 ultimately achieve a true Hamiltonian cycle that ends adjacent to the starting node:

&#10005

It turns out that one can reach each of these states through 4 distinct paths from the root of the multiway graph. An example of such a path is:

&#10005

We can summarize this path as a Hamiltonian circuit of the original cube graph:

&#10005

In the multiway graph, the 12 “winning paths” are

&#10005

In a different rendering this becomes

&#10005

and keeping only “winning paths” the subgraph of the multiway graph has the symmetrical form:

&#10005

The actual Hamiltonian circuits through the underlying cube graph corresponding to these winning paths are:

&#10005

For the dodecahedral graph (i.e. the original Icosian game), the multiway graph is larger and more complicated. It begins

&#10005

and has its first merge after 11 steps (and 529 in all), and ends up with a total of 11,093 nodes—of which 2446 are “end states” where no further move is possible. This shows the number of end (below) and non-end (above) states at each successive step:

&#10005

The successive fractions of “on-track-to-succeed” states are as follows, indicating that the puzzle is in a sense harder at the beginning than at the end:

&#10005

There are 13 “end states” which fill in every position of the underlying dodecahedral graph, with 3 of these corresponding to Hamiltonian cycles:

&#10005

The total number of paths from the root of the multiway graph leading to end states (in effect the total number of ways to try to solve the puzzle) is 3120. Of these, 60 lead to the 3 Hamiltonian cycle end states. An example of one of these “winning paths” is:

&#10005

Examples of underlying Hamiltonian cycles corresponding to each of the 3 Hamiltonian cycle end states are:

&#10005

And this now shows all 60 paths through the multiway graph that reach Hamiltonian cycle end states—and thus correspond to solutions to the puzzle:

&#10005

In effect, solving the puzzle consists in successfully finding these paths out of all the possibilities in the multiway graph. In practice, though—much as in theorem-proving, for example—there are considerably more efficient ways to find “winning paths” than to look directly at all possibilities in the multiway graph (e.g. FindHamiltonianCycle in Wolfram Language). But for our purpose of understanding games and puzzles in a multicomputational framework, it’s useful to see how solutions to this puzzle lay out in the multiway graph.

The Icosian game from Hamilton was what launched the idea of Hamiltonian cycles on graphs. But already in 1736 Leonhard Euler had discussed what are now called Eulerian cycles in connection with the puzzle of the Bridges of Königsberg. In modern terms, we can state the puzzle as the problem of finding a path that visits once and only once all the edges in the graph (in which the “double bridges” from the original puzzle have been disambiguated by extra nodes):

&#10005

We can create a multiway graph that represents all possible paths starting from a particular vertex:

&#10005

But now we see that the end states here are

&#10005

and since none of them have visited every edge, there is no Eulerian circuit here. To completely resolve the puzzle we need to make a multiway graph in which we start from all possible underlying vertices. The result is a disconnected multiway graph whose end states again never visit every edge in the underlying graph (as one can tell from the fact that the number of “levels” in each subgraph is less than 10):

&#10005


The Geography Game

In the Geography Game one has a collection of words (say place names) and then one attempts to “string the words together”, with the last letter of one word being the same as the first letter of the next. The game typically ends when nobody can come up with a word that works and hasn’t been used before.

Usually in practice the game is played with multiple players. But one can perfectly well consider a version with just one player. And as an example let’s take our “words” to be the abbreviations for the states in the US. Then we can make a graph of what can follow what:

&#10005

Let’s at first ignore the question of whether a state has “already been used”. Then, starting, say, from Massachusetts (MA), we can construct the beginning of a multiway graph that gives us all possible sequences:

&#10005

After 10 steps the graph is

&#10005

or in a different rendering:

&#10005

This shows the total number of paths as a function of length through this graph, assuming one doesn’t allow any state to be repeated:

&#10005

The maximum length of path is 23—and there are 256 such paths, 88 ending with TX and 168 ending with AZ. A few sample such paths are

&#10005

and all these paths can be represented by what amounts to a finite state machine:

&#10005

By the way, the starting state that leads to the longest path is MN—which achieves length 24 in 2336 different ways, with possible endings being AZ, DE, KY and TX. A few samples are:

&#10005

Drawing these paths in the first few steps of the multiway graph starting from MN we get:

&#10005


Groups and (Simplified) Rubik’s Cubes

We’ve talked about puzzles that effectively involve walks on graphs. A particularly famous example of a puzzle that can be thought about in this way is the Rubik’s Cube. The graph in question is then the Cayley graph for the group formed by the transformations that can be applied to the cube.

As a very simple analog, we can consider the symmetry group of the square, D4, based on the operations of reflection and 90° rotation. We generate the Cayley graph just like a multiway graph: by applying each operation at each step. And in this example the Cayley graph is:

&#10005

This graph is small enough that it is straightforward to see how to get from any configuration to any other. But while this Cayley graph has 8 nodes and maximum path length from any one node to any other of 3, the Cayley graph for the Rubik’s Cube has nodes and a maximum shortest path length of 20.

To get some sense of the structure of an object like this, we can consider the very simplified case of a “2×2×2 cube”—colored only on its corners—in which each face can be rotated by 90°:

&#10005

The first step in the multiway graph—starting from the configuration above—is then (note that the edges in the graph are not directed, since the underlying transformations are always reversible):

&#10005

Going another step gives:

&#10005

The complete multiway graph (which is also the Cayley graph for the group—which turns out to be S8—generated by the transformations) has 8! = 40,320 nodes (and 483,840 edges). Starting from a state (i.e. node in the Cayley graph) the number of new states reached at successive steps is:

&#10005

The maximum shortest paths in the graph consist of 8 steps; an example is:

&#10005

Between these particular two endpoints there are actually 3216 “geodesic” paths—which spread out quite far in the multiway graph

&#10005

Picking out only geodesic paths we see there are many ways to get from one configuration of the cube to one of its “antipodes”:

&#10005


Peg Solitaire

Whereas something like tic-tac-toe involves progressively filling in a board, a large class of puzzles that have been used since at least the 1600s involve basically removing pegs from a board. The typical rules involve pegs being able to jump over a single intermediate peg into a hole, with the intermediate peg then being removed. The goal is to end up with just a single peg on the board.

Here’s a very simple example based on a T arrangement of pegs:

&#10005

In this case, there’s only one way to “solve the puzzle”. But in general there’s a multiway graph:

&#10005

A more complicated example is the “Tricky Triangle” (AKA the “Cracker Barrel puzzle”). Its multiway graph begins:

&#10005

After another couple of steps it becomes:

&#10005

There are a total of 3016 states in the final multiway graph, of which 118 are “dead-end” configurations from which no further moves are possible. The “earliest” of these dead-end configurations are:

&#10005

There are just 4 “winning states” that can be reached, and the “end games” that lead to them are:

&#10005

Starting from the initial configuration, the number of possible states reached at each step is given as follows, where the states that can lead to winning configurations is shown in yellow:

&#10005

This shows the complete multiway graph, with “winning paths” highlighted:

&#10005

At successive steps, the fraction of states that can lead to a winning state is as follows:

&#10005

The branchial graphs are highly connected, implying that in a sense the puzzle remains “well mixed” and “unpredictable” until the very end:

&#10005


Checkers

Peg solitaire is a one-player “game”. Checkers (AKA draughts) is a two-player game with a somewhat similar setup. “Black” and “red” pieces move diagonally in different directions on a board, “taking” each other by jumping over when they are adjacent.

Let’s consider the rather minimal example of a 4×4 board. The basic set of possible moves for “black” and “red” is defined by the graphs (note that a 4×4 board is too small to support “multiple jumps”):

&#10005

With this setup we can immediately start to generate a multiway graph, based on alternating black and red moves:

&#10005

With the rules as defined so far, the full 161-node multiway graph is:

&#10005

It’s not completely clear what it means to “win” in this simple 4×4 case. But one possibility is to say that it happens when the other player can’t do anything at their next move. This corresponds to “dead ends” in the multiway graph. There are 26 of these, of which only 3 occur when it is red’s move next, and the rest all occur when it is black’s move:

&#10005

As before, any particular checkers game corresponds to a path in the multiway graph from the root to one of these end states. If we look at branchial graphs in this case, we find that they have many disconnected pieces, indicating that there are many largely independent “game paths” for this simple game—so there is not much “mixing” of outcomes:

&#10005

&#10005

The rules we’ve used so far don’t account for what amounts to the second level of rules for checkers: the fact that when a piece reaches the other side of the board it becomes a “king” that’s allowed to move backwards as well as forwards. Even with a single piece and single player this already generates a multiway graph—notably now with loops:

&#10005

or in an alternative layout (with explicitly undirected edges):

&#10005

With two pieces (and two players taking turns) the “kings” multiway graph begins:

&#10005

With this initial configuration, but without backward motion, the whole multiway graph is just:

&#10005

The full “kings” multiway graph in this case also only has 62 nodes—but includes all sorts of loops (though with this few pieces and black playing first it’s inevitable that any win will be for black):

&#10005

What about the ordinary + kings multiway graph from our original initial conditions? The combined graph has 161 nodes from the “pre-king” phase, and 4302 from the “post-king” phase—giving the final form:

&#10005


(Very Simplified) Go

The full game of Go is sophisticated and its multiway graph in any realistic case is far too big for us to generate at all explicitly (though one can certainly wonder if there are meaningful “continuum limit” results). However, to get some flavor of Go we can consider a vastly simplified version in which black and white “stones” are progressively placed on nodes of a graph, and the game is considered “won” if one player has successfully surrounded a connected collection of the other player’s stones.

Imagine that we start with a blank “board” consisting of a 2×2 square of positions, then on a sequence of “turns” add black and white stones in all possible ways. The resulting multiway graph is:

&#10005

Every state that has no successor here is a win for either black or white. The “black wins” (with the surrounded stone highlighted) are

&#10005

while the “white wins” are:

&#10005

At this level what we have is basically equivalent to 2×2 tic-tac-toe, albeit with a “diagonal” win condition. With a 3×2 “board”, the first two steps in the multiway graph are:

&#10005

The final multiway graph is:

&#10005

The graph has 235 nodes, of which 24 are wins for white, and 34 for black:

&#10005

The successive branchial graphs in this case are (with wins for black and white indicated):

&#10005

For a 3×3 “board” the multiway graph has 5172 states, with 604 being wins for white and 684 being wins for black.

Nim

As another example of a simple game, we’ll now consider Nim. In Nim, there are k piles of objects, and at each step p players alternate in removing as many objects as they want from whatever single pile they choose. The loser of the game is the player who is forced to have 0 objects in all the piles.

Starting off with 2 piles each containing 2 objects, one can construct a multiway graph for the game:

&#10005

With 3 piles this becomes:

&#10005

These graphs show all the different possible moves that relate different configurations of the piles. However, they do not indicate which player moves when. Adding this we get in the 22 case

&#10005

and in the 222 case:

&#10005

Even though these graphs look somewhat complicated, it turns out there is a very straightforward criterion for when a particular state has the property that its “opponent” can force a lose: just take the list of numbers and see if Apply[BitXor, list] is 0. Highlighting when this occurs we get:

&#10005

It turns that for Nim, the sequence of branchial graphs we get have a rather regular structure. In the 22 case, with the same highlighting as before, we get:

&#10005

In the 222 case the sequence of branchial graphs becomes:

&#10005

Here are results for some other cases:

&#10005


Sliding Block Puzzles

They go under many names—with many different kinds of theming. But many puzzles are ultimately sliding block puzzles. A simple example might ask to go from

&#10005

by sliding blocks into the empty (darker) square. A solution to this is:

&#10005

One can use a multiway graph to represent all possible transformations:

&#10005

(Note that only 12 of the 4! = 24 possible configurations of the blocks appear here; a configuration like cannot be reached.)

Since blocks can always be “slid both ways” every edge in a sliding-block-puzzle multiway graph has an inverse—so going forward we’ll just draw these multiway graphs as undirected.

Here are some simple cases:

&#10005

&#10005

With a 3×2 board, things quickly get more complicated:

&#10005

Rendered in 3D this becomes:

&#10005

When all the blocks are distinct, one tends to get multiway graphs with a kind of spherical structure:

&#10005

(Note that in the first three cases here, it’s possible to reach all 30, 120, 360 conceivable arrangements of the blocks, while in the last case one can only reach “even permutations” of the blocks, or 360 of the 720 conceivable arrangements.)

This shows how one gets from to :

&#10005

With many identical blocks one tends to build up a simple lattice:

&#10005

Making one block different basically just “adds decoration”:

&#10005

As the number of “1” and “2” blocks becomes closer to equal, the structure fills in:

&#10005

Adding a third type of block rapidly leads to a very complicated structure:

&#10005

This summarizes a few of the graphs obtained:

&#10005

&#10005


Towers of Hanoi, etc.

Another well-known puzzle is the Towers of Hanoi. And once again we can construct a multiway graph for it. Starting with all disks on the left peg the first step in the multiway graph is:

&#10005

Going two steps we get:

&#10005

The complete multiway graph is then (showing undirected edges in place of pairs of directed edges):

&#10005

It is rather easy to see how the recursive structure of this multiway graph builds up. Here’s the “base case” of 2 disks (and 3 pegs):

&#10005

And as each disk is added, the number of nodes in the multiway graph increases by a factor of 3—yielding for example with 4 disks (and still 3 pegs):

&#10005

With 4 pegs, things at first look more complicated, even with 2 disks:

&#10005

In a 3D rendering, more structure begins to emerge:

&#10005

And here are the results for 3, 4 and 5 disks—with the “points of the ears” corresponding to states where all the disks are on a single peg:

&#10005

With 3 pegs, the shortest “solution to the puzzle”—of moving all disks from one peg to another—goes along the “side” of the multiway graph, and for n pegs is of length 2n – 1:

&#10005

With 4 pegs, there is no longer a unique “geodesic path”:

&#10005

(And the sequence of path lengths for successive numbers of pegs is

&#10005

or a little below for a large number of pegs n.)

What about branchial graphs? For the standard 3-disk 3-peg case we have

&#10005

where successive “time slices” are assumed to be obtained by looking at successive vertical levels in the rendering of the multiway graph above.

For 4 disks one essentially gets “more of the same”:

&#10005

With 4 pegs things become slightly more complicated:

&#10005

And the trend continues for 5 pegs:

&#10005


Multicomputational Implications & Interpretation

We’ve now gone through many examples of games and puzzles. And in each case we’ve explored the multiway graphs that encapsulate the whole spectrum of their possible behavior. So what do we conclude? The most obvious point is that when games and puzzles seem to us difficult—and potentially “interesting”—it’s some kind of reflection of apparent complexity in the multiway graph. Or, put another way, it’s when we find the multiway graph somehow “difficult to decode” that we get a rich and engaging game or puzzle.

In any particular instance of playing a game we’re basically following a specific path (that in analogy to physics we can call a “timelike path”) through the multiway graph (or “game graph”) for the game. And at some level we might just make the global statement that the game graph represents all such paths. But what the multicomputational paradigm suggests is that there are also more local statements that we can usefully make. In particular, at every step along a timelike path we can look “transversally” in the multiway graph, and see the “instantaneous branchial graph” that represents the “entanglement” of our path with “nearby paths”.

Figuring out “what move to make next” is then in a sense about deciding in “what direction” in branchial space to go. And what makes a game difficult is that we can’t readily predict what happens as we “travel through branchial space”. There’s a certain analogy here to the concept of computational irreducibility. Going from one state to another along some timelike path, computational irreducibility implies that even though we may know the underlying rules, we can’t readily predict their consequences—because it can require an irreducible amount of computation to figure out what their consequences will be after many steps.

Predicting “across branchial space” is a related, but slightly different phenomenon, that one can describe as “multicomputational irreducibility”. It’s not about the difficulty of working out a particular path of computation, but instead about the difficulty of seeing how many entangled paths interact.

When one plays a game, it’s common to talk about “how many moves ahead one can see”. And in our terms here, this is basically about asking how “far out in branchial space” we can readily get. As computationally bounded entities, we have a certain “reach” in branchial space. And the game is “difficult for us” if that reach isn’t sufficient to be able to get to something like a “winning position”.

There’s another point here, though. What counts as “winning” in a game is typically reaching some particular places or regions in the multiway graph. But the definition of these places or regions is typically something very computationally bounded (“just see if there’s a line of X’s”, etc.). It’s a certain “observation” of the system, that extracts just a particular (computationally bounded) sampling of the complete state. And then what’s key is that this sampling doesn’t manage to “decode the multicomputational irreducibility”.

There’s an analogy here to thermodynamics. The fact that in thermodynamics we perceive “heat” and “entropy increase” is a consequence of the fact that our (coarse-grained) measurements can’t “decode” the computationally irreducible process that leads to the particular states generated in the system. Similarly, the fact we perceive it to be “hard to figure out how to win a game” is a consequence of the fact that our criterion for winning isn’t able to “look inside the playing of the game” and “decode what’s going on” to the point where it’s in effect just selecting one particular, straightforward path. Instead it’s a question of going through the multicomputationally irreducible process of playing the game, and in effect “seeing where it lands” relative to the observation of winning.

There’s also an analogy here to quantum mechanics. Tracing through many possible paths of playing a game is like following many threads of history in quantum mechanics, and the criterion of winning is like a quantum measurement that selects certain threads. In our Physics Project we imagine that we as observers are extended in branchial space, “knitting together” different threads of history through our belief in our own single thread of experience. In games, the analog of our belief in a single thread of experience is presumably in effect that “all that matters is who wins or loses; it doesn’t matter how the game is played inside”.

To make a closer analogy with quantum mechanics one can start thinking about combining different chunks of “multiway game play”, and trying to work out a calculus for how those chunks fit together.

The games we’ve discussed here are all in a sense pure “games of skill”. But in games where there’s also an element of chance we can think of this as causing what is otherwise a single path in the multiway graph to “fuzz out” into a bundle of paths, and what is otherwise a single point in branchial space to become a whole extended region.

In studying different specific games and puzzles, we’ve often had to look at rather simplified cases in order to get multiway graphs of manageable size. But if we look at very large multiway graphs, are there perhaps overall regularities that will emerge? Is there potentially some kind of “continuum limit” for game graphs?

It’ll almost inevitably be the case that if we look in “enough detail” we’ll see all sorts of multicomputational irreducibility in action. But in our Physics Project—and indeed in the multicomputational paradigm in general—a key issue is that relevant observers don’t see that level of detail. And much like the emergence of thermodynamics or the gas laws from underlying molecular dynamics, the very existence of underlying computational irreducibility inevitably leads to simple laws for what the observer can perceive.

So what is the analog of “the observer” for a game? For at least some purposes it can be thought of as basically the “win” criteria. So now the question arises: if we look only at these criteria, can we derive the analog of “laws of physics”, insensitive to all the multicomputationally irreducible details underneath?

There’s much more to figure out about this, but perhaps one place to start is to look at the large-scale structure of branchial space—and the multiway graph—in various games. And one basic impression in many different games is that—while the character of branchial graphs may change between “different stages” in the game—across a single branchial graph there tends to be a certain uniformity. If one looks at the details there may be plenty of multicomputational irreducibility. But at some kind of “perceptible level” different parts of the graph may seem similar. And this suggests that the “local impression of the game” will tend to be similar at a particular stage even when quite different moves have been made, that take one to quite different parts of the “game space” defined by the branchial graph.

But while there may be similarity between different parts of the branchial graph, what we’ve seen is that in some games and puzzles the branchial graph breaks up into multiple disconnected regions. And what this reflects is the presence of distinct “conserved sectors” in a game—regions of game space that players can get into, but are then stuck with (at least for a certain time), much as in spacetime event horizons can prevent transport between different regions of physical space.

Another (related) effect that we notice in some games and puzzles but not others is large “holes” in the multiway graph: places where between two points in the graph there are multiple “distant” paths. When the multiway graph is densely connected, there’ll typically always be a way to “fix any mistake” by rerouting through nearby paths. But when there is a hole it is a sign that one can end up getting “committed” to one course of action rather than another, and it will be many steps before it’s possible to get to the same place as the other course of action would have reached.

If we assume that at some level all we ultimately “observe” in the multiway graph is the kind of coarse-graining that corresponds to assessing winning or losing then inevitably we’ll be dealing with a distribution of possible paths. Without “holes” these paths can be close together, and may seem obviously similar. But when there’s a hole there can be different paths that are far apart. And the fact there can be distant paths that are “part of the same distribution” can then potentially be thought of as something like a quantum superposition effect.

Are there analogs of general relativity and the path integral in games? To formulate this with clarity we’d have to define more carefully the character of “game space”. Presumably there’ll be the analog of a causal graph. And presumably there’ll also be an analog of energy in game space, associated with the “density of activity” at different places in game space. Then the analog of the phenomenon of gravity will be something like that the best game plays (i.e. the geodesic paths through the game graph) will tend to be deflected by the presence of high densities of activity. In other words, if there are lots of things to do when a game is in a certain state, good game plays will tend to be “pulled towards that state”. And at some level this isn’t surprising: when there’s high density of activity in the game graph, there will tend to be more options about what to do, so it’s more likely that one will be able to “do a good game play” if one goes through there.

So far we didn’t explicitly talk about strategies for games. But in our multicomputational framework a strategy has a fairly definite interpretation: it is a place in rulial space, where in effect one’s assuming a certain set of rules about how to construct the multiway graph. In other words, given a strategy one is choosing some edges in the multiway graph (or some possible events in the associated multiway causal graph), and dropping others.

In general it can be hard to talk about the “space of possible strategies”—because it’s like talking about the “space of possible programs”. But this is precisely what rulial space lets us talk about. What exact “geometry” the “space of strategies” has will depend on how we choose to coordinatize rulial space. But once again there will tend to be a certain level of coarse-graining achieved by looking only at the kinds of things one discusses in game theory—and at this level we can expect that all sorts of standard “structural” game-theoretic results will generically hold.

Personal Notes

Even as a kid I was never particularly into playing games or doing puzzles. And maybe it’s a sign I was always a bit too much of a scientist. Because just picking specific moves always seemed to me too arbitrary. To get my interest I needed a bigger picture, more of a coherent intellectual story. But now, in a sense, that’s just what the multicomputational approach to games and puzzles that I discuss here is bringing to us. Yes, it’s very “humanizing” to be able think about making particular moves. But the multicomputational approach immediately gives one a coherent global view that, at least to me, is intellectually much more satisfying.

The explorations I’ve discussed here can be thought of as originating from a single note in A New Kind of Science. In Chapter 5 of A New Kind of Science I had a section where I first introduced multiway systems. And as the very last note for that section I discussed “Game systems”:

Game systems
&#10005

I did the research for this in the 1990s—and indeed I now find a notebook from 1998 about tic-tac-toe with some of the same results derived here

Tic-tac-toe ListPlot
&#10005

together with a curious-looking graphical representation of the tic-tac-toe game graph:

Tic-tac-toe game graph
&#10005

But back at that time I didn’t conclude much from the game graphs I generated; they just seemed large and complicated. Twenty years passed and I didn’t think much more about this. But then in 2017 my son Christopher was playing with a puzzle called Rush Hour:

Rush Hour game

And perhaps in a sign of familial tendency he decided to construct its game graph—coming up with what to me seemed like a very surprising result:

Rush Hour game graph
&#10005

At the time I didn’t try to understand the structure one has here—but I still “filed this away” as evidence that game graphs can have “visible large-scale structure”.

A couple of years later—in late 2019—our Physics Project was underway and we’d realized that there are deep relations between quantum mechanics and multiway graphs. Quantum mechanics had always seemed like something mysterious—the abstract result of pure mathematical formalism. But seeing the connection to multiway systems began to suggest that one might actually be able to “understand quantum mechanics” as something that could “mechanically arise” from some concrete underlying structure.

I started to think about finding ways to explain quantum mechanics at an intuitive level. And for that I needed a familiar analogy: something everyday that one could connect to multiway systems. I immediately thought about games. And in September 2020 I decided to take a look at games to explore this analogy in more detail. I quickly analyzed games like tic-tac-toe and Nim—as well as simple sliding block puzzles and the Towers of Hanoi. But I wanted to explore more games and puzzles. And I had other projects to do, so the multicomputational analysis of games and puzzles got set aside. The Towers of Hanoi reappeared earlier this year, when I used it as an example of generating a proof-like multiway graph, in connection with my study of the physicalization of metamathematics. And finally, a few weeks ago I decided it was time to write down what I knew so far about games and puzzles—and produce what’s here.

Thanks

Thanks to Brad Klee and Ed Pegg for extensive help in the final stages of the analysis given here—as well as to Christopher Wolfram for inspiration in 2017, and help in 2020.

❌